Healthcare Public Health
Healthcare public health relates to the effectiveness and quality of health services and their associated health outcomes. Our local NHS commissioner is NHS Cambridgeshire and Peterborough Clinical Commissioning Group (CCG). These pages bring together information relating to our local health service and CCG.
NHS Cambridgeshire and Peterborough CCG
From April 2013, Clinical Commissioning Groups (CCGs) took over the responsibility from Primary Trust Care Trusts (PCTs) for planning and commissioning health services across the country. Led by GPs and clinicians, Clinical Commissioning Groups work with patients and healthcare professionals and in partnership with local communities and local authorities.
NHS Cambridgeshire and Peterborough CCG is one of the largest CCGs in England with 88 practices as members, which covers all GP practices in Cambridgeshire and Peterborough, as well as two in North Hertfordshire and two in Northamptonshire. The CCG is responsible for planning and buying local NHS services, such as the care provided at hospitals and in the community, as well as ensuring these services deliver the best possible care and treatment for patients. During 2019 practices came together in 21 Primary Care Networks.
CCG Map and population
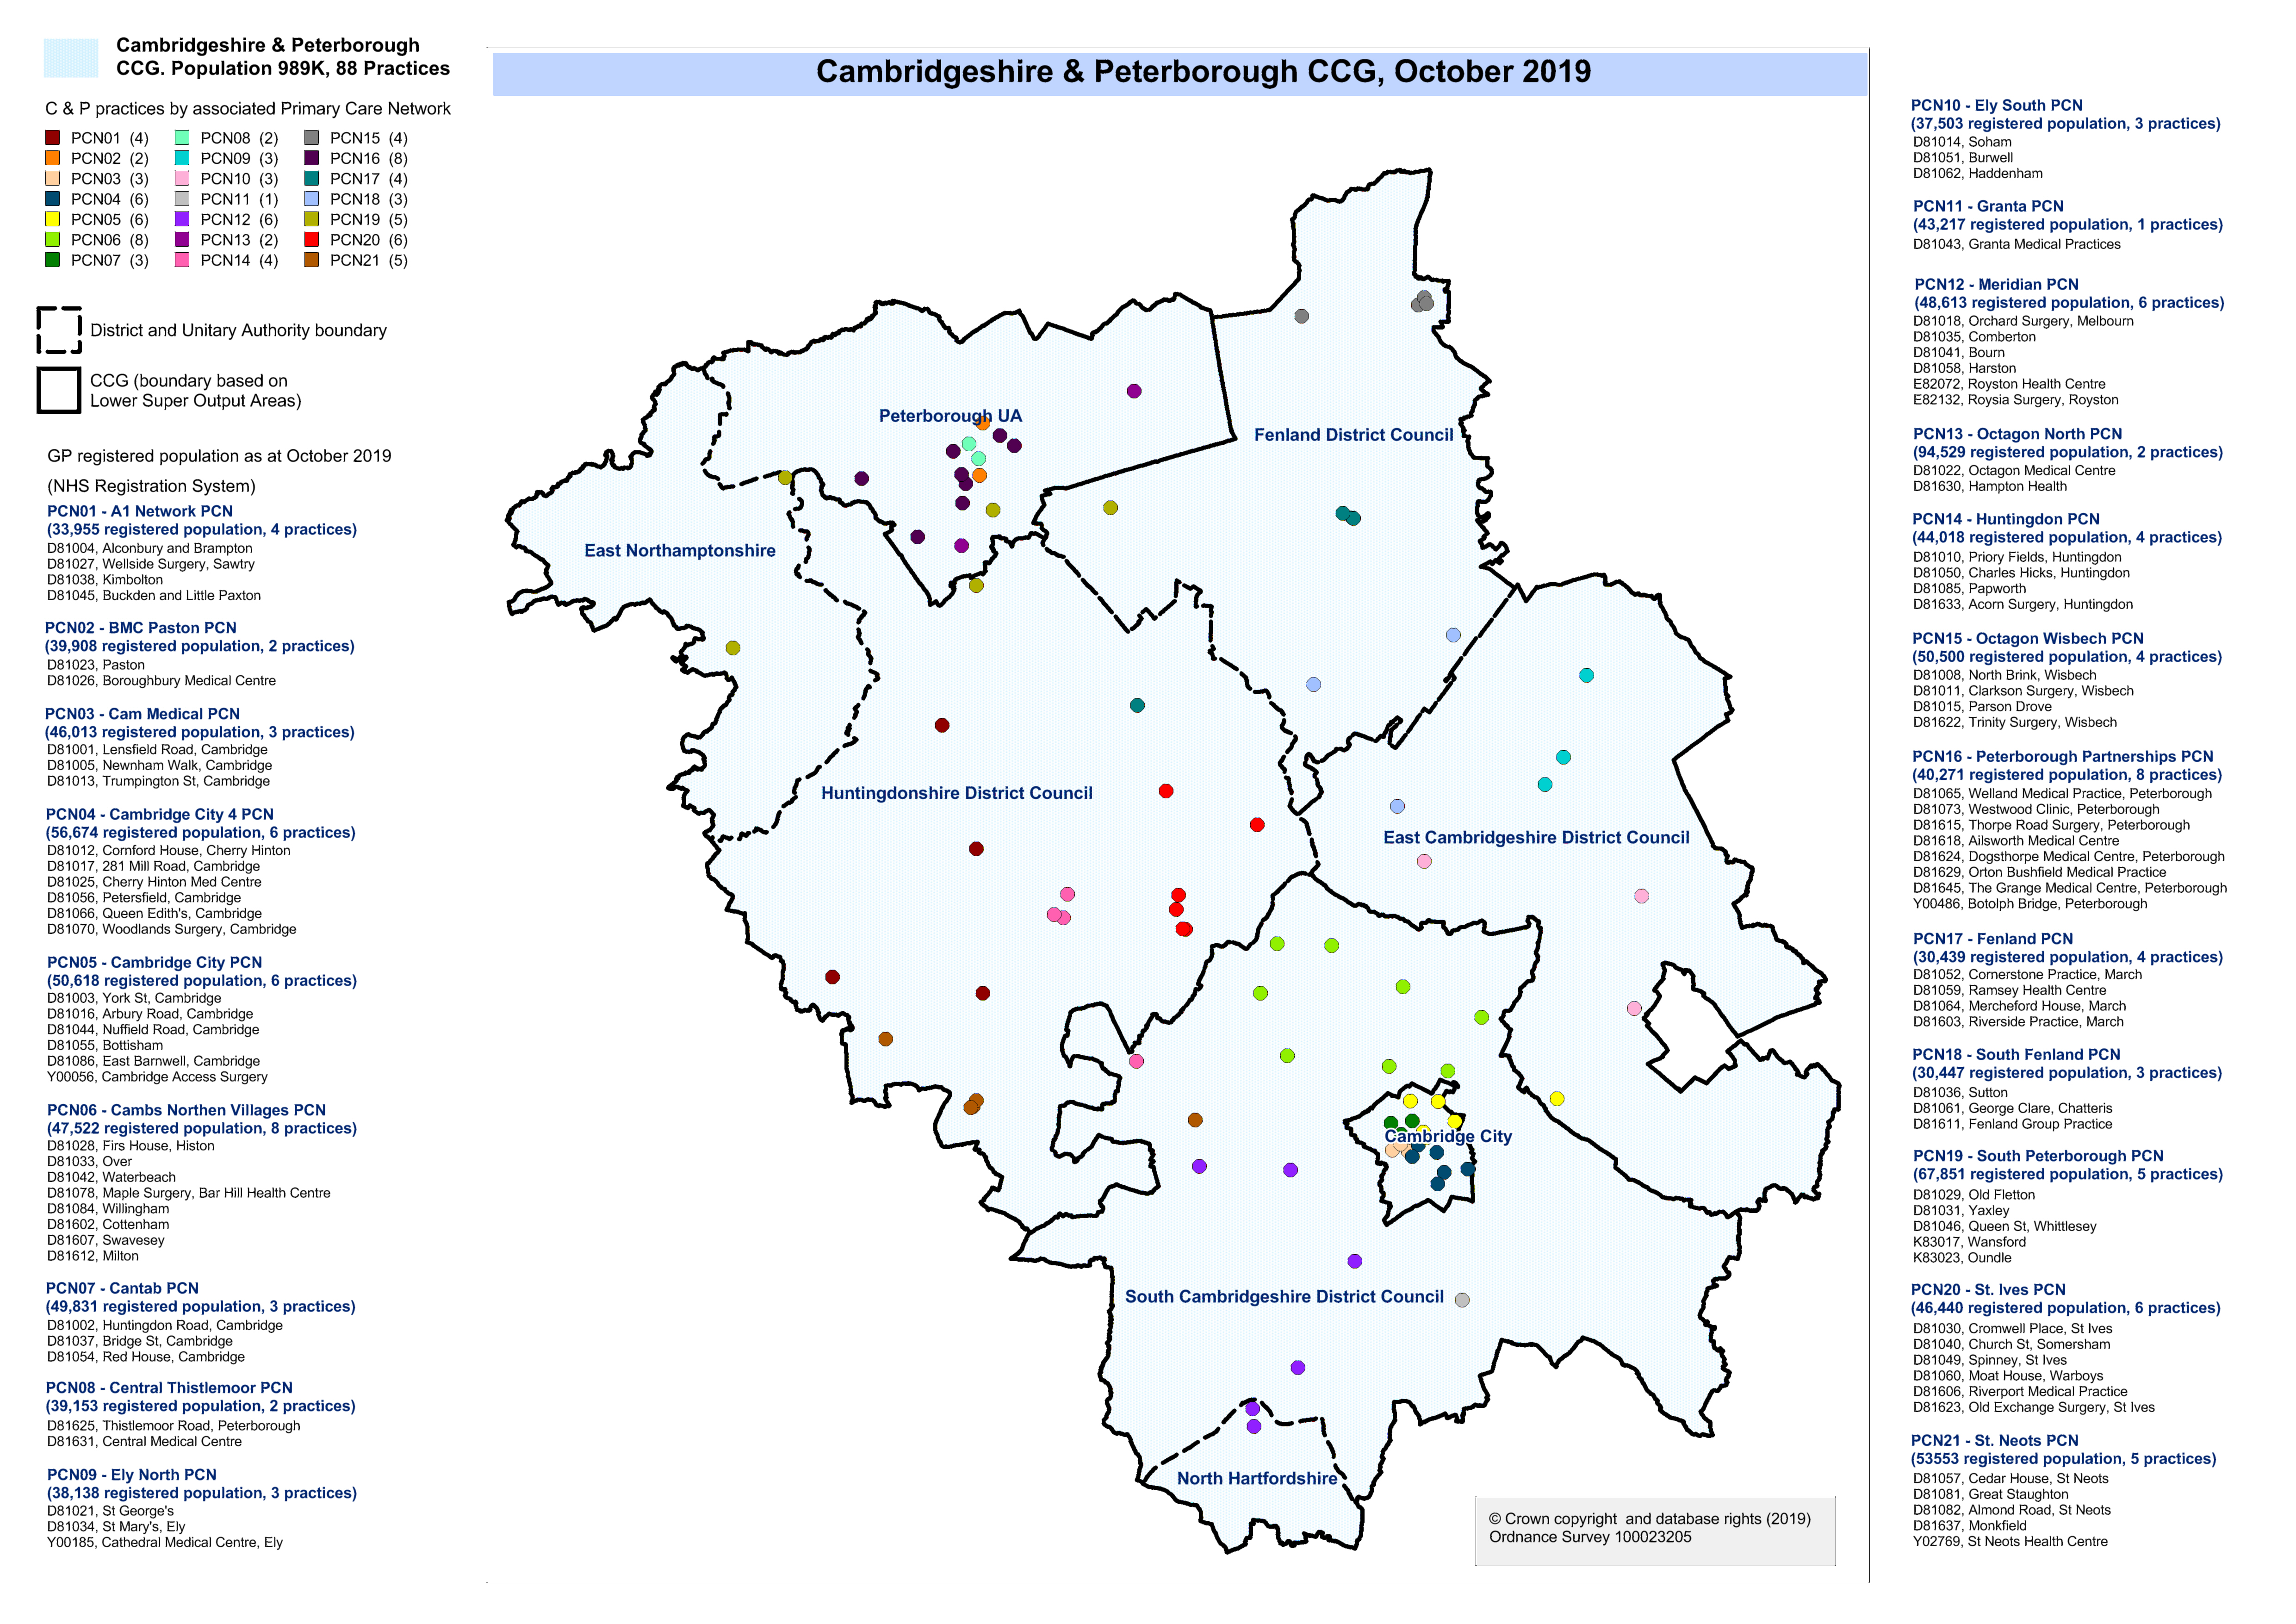
The map here shows the official boundary of NHS Cambridgeshire and Peterborough CCG. It also shows the locations of the practices within the CCG and the Primary Care Networks that each practice is a member of. Local authority boundaries are also shown. The north west of the CCG’s area crosses the boundary of East Northamptonshire, and to the south, North Hertfordshire.
Please note: The map is based on the practices and Primary Care Networks as at October 2019.
Click here to view the CCG map in full size
North and South Provider Alliances
The data packs below provide demographic, risk factor, disease prevalence and mortality data, some disease specific admission rates, children’s and adult social care rates and secondary care service use rates for the North and South Provider Alliances.
North Alliance Population Health Data Pack November 2019
South Alliance Population Health Data Pack November 2019
The Excel workbook below includes all of the metrics on one page, to allow the data to be more easily compared across a range of indicators. The workbook can also be filtered by PCN so that comparison can be made at practice, PCN, Alliance and CCG level.
The data are not shown at a practice level for the following indicators: population forecasts; ethnicity; long term life-limiting illness, good or very good health and the number of social care users because the data are not readily available. Hospital admission rates for 2018/19 are not shown at practice level due to small numbers.
Primary Care Networks
The data packs below (November 2019) have been updated and in addition to the original content (demographics, risk factors, disease prevalence and mortality data) now also include: children’s and adult social care rates; secondary care service use rates and some disease specific emergency admission rates.
Indices of Multiple Deprivation data have been updated to 2019 and the following indicators: births; life expectancy; obesity and smoking prevalence, are now shown at practice level.
A1 Network PCN Population Health Data Pack November 2019 (Alconbury and Brampton, Buckden and Little Paxton, Kimbolton, Wellside Surgery)
BMC Paston PCN Population Health Data Pack November 2019 (Boroughbury Medical Centre, Paston)
Cantab PCN Population Health Data Pack November 2019 (Bridge Street, Huntingdon Road, Red House)
Cantab PCN Population Health Data Pack November 2019 Summary Infographic
Ely South PCN Population Health Data Pack November 2019 (Burwell, Haddenham, Soham)
Granta PCN Population Health Data Pack November 2019 (Granta Medical Practices)
Healthcare Prevention Strategy
Health System Prevention Strategy for Cambridgeshire and Peterborough was produced in January 2016 in recognition of the impact of preventable ill health on the local health economy and to identify opportunities for action.
Significant proportions of ill health and health service activity are potentially preventable. A recent Public Health England Lancet publication about the global burden of disease found that 40% of the NHS workload is potentially preventable, yet the proportion of health expenditure directed at prevention, although hard to estimate reliably, is probably closer to 4%. [1]
Prevention, at all levels has been recognised as critical to building a sustainable health system. NHS England’s Five Year Forward View states that ‘The future health of millions of children, the sustainability of the NHS, and the economic prosperity of Britain all now depend on a radical upgrade in prevention and public health.’
The objectives of producing the strategy were:
- To identify the savings to the NHS, where possible, from current and planned prevention initiatives.
- To identify areas/interventions for potential additional NHS investment in prevention which would maximise savings to the local NHS over the next three, five, 10 years and beyond.
- Identify areas and initiatives for potential stretch and outline the strategy for delivering these including projected savings to the NHS, where possible.
[1] Changes in health in England, with analysis by English regions and areas of deprivation, 1990-2013: a systematic analysis for the Global Burden of Disease Study 2013. John N Newton et al. The Lancet. September 15, 2015 (15) 00195-6.
Quality and Outcomes Framework (QOF)
The Quality and Outcomes Framework (QOF) is the annual reward and incentive programme detailing GP practice achievement results. It rewards practices for the provision of quality care and helps standardise improvement in the delivery of primary medical services. QOF data are released nationally by NHS Digital at https://digital.nhs.uk/data-and-information/data-tools-and-services/data-services/general-practice-data-hub/quality-outcomes-framework-qof. Data from QOF include disease prevalence data for a number of health conditions:
- Arthritis
- Asthma
- Atrial fibrillation
- Cancer
- Coronary Heart Disease (CHD)
- Chronic Kidney Disease
- Chronic Obstructive Pulmonary Disease (COPD)
- Dementia
- Depression
- Diabetes
- Epilepsy
- Heart failure
- Hypertension
- Hypothyroidism
- Learning disabilities
- Left ventricular dysfunction
- Mental Health
- Obesity
- Osteoporosis
- Peripheral arterial disease
- Palliative care
- Stroke and transient ischaemic attack
(Conditions included vary by year)
Local QOF analysis
We use the data from NHS Digital, linked to other sources, to do additional analysis for Cambridgeshire and Peterborough, making the results available in a modifiable pivot tool:
Cambridgeshire and Peterborough QOF Pivot Tool
Our analysis provides:
- An extract of data for practices in Cambridgeshire and Peterborough Clinical Commissioning Group
- Data for all QOF years from 2008/09 to 2018/19
- Calculated 95% confidence intervals allowing statistical comparison
- Assessment of statistical significance against local and national averages
- Aggregate data for Primary Care Networks, North and South Alliances and deprivation groups
- Proxy data for upper- and lower-tier local authorities based on practice location
- Proxy data for local authority IMD groupings based on practice location
PHE National General Practice Profiles
Public Health England produce the National General Practice Profiles, which also contain QOF data. The profiles present an interactive tool containing demographic, cancer, cardiovascular disease, diabetes, mental health, MSK and respiratory disease data.
Atlas of Variation
The NHS Atlas of Variation in Healthcare 2015 is a collaboration between NHS England, Public Health England and NHS Right Care, presenting data for over 100 indicators relating to healthcare interventions and disease. The NHS Atlas highlights unwarranted variation in quality, cost, activity and health outcomes between local health economies, prompting action to improve quality and value.
Or local Cambridgeshire and Peterborough CCG Atlas of Variation 2015 focusses on indicators in the NHS Atlas that present data at CCG level, highlighting where the CCG’s position is in the top or bottom 20% of CCG’s nationally, and how the CCG compares to its ‘statistical neighbours’.
Analysis of multi-morbidity prevalence in Cambridgeshire & Peterborough
In August 2018, Public Health Intelligence produced a report analysing multi-morbidity prevalence across Cambridgeshire & Peterborough based on information released by Public Health England. The report is available h