Anti-Social Behaviour
Anti-social behaviour (ASB) is any behaviour that causes harm, distress, or nuisance to others in the community.
It can affect people’s quality of life and make them feel unsafe in their own homes or neighbourhoods.
Local police, councils, and social housing providers collaborate to address antisocial behaviour, though their approaches may vary from one area to another (Office, 2024), with a goal of keeping our communities safer.
Examples of antisocial behaviour:
Antisocial behaviour can include both criminal and non-criminal behaviour, for example:

How you can help by reporting
Who you report antisocial behaviour to depends on the type of behaviour it is and where it takes place:
- Cambridgeshire Constabulary – if you feel threatened or you think the behaviour could be breaking the law.
- Your District – if it affects your local area.
For further guidance regarding reporting ASB by district please use the following links;
Explore ongoing support
You can get support to deal with antisocial behaviour from:
Real-life impact/Victims experience


YouTube video: How the lives of thousands of people are being destroyed by anti-social behaviour
National
The Crime Survey for England and Wales (CSEW) for year ending (YE) December 2025 showed that an estimated 39% of people experienced or witnessed anti-social behaviour (ASB). This was an increase from the previous year (36%). Although some of this increase was likely to be genuine, it may also have been because of changes to the ordering of questions in the CSEW questionnaire that were made in April 2025 (ONS, 2026).
Recent inspections by His Majesty’s Inspectorate of Constabulary and Fire & Rescue Services (HMICFRS) have found that many forces needed to improve how they identify and record antisocial behaviour. For further information see the HMICFRS report here, The policing response to antisocial behaviour: PEEL spotlight report – His Majesty’s Inspectorate of Constabulary and Fire & Rescue Services.
Local analysis

Figure 1: Count of ASB in Cambridgeshire between April 2022 and March 2026
Figure 1 details count of ASB incidents by month in Cambridgeshire. The chart shows a strong seasonal pattern, with peaks consistently occurring during the summer months and lower activities in winter. However, overall levels have steadily increased over time, with 2025 recording the highest volumes.
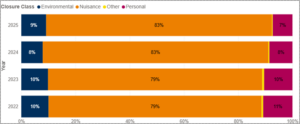
Figure 2: Proportion of Classes of ASB in Cambridgeshire between 2022 and 2025
Figure 2 details proportion of ASB incidents by class (category) from 2022 to 2025, in Cambridgeshire. The chart highlights that nuisance ASB consistently accounts for the highest proportion of incidents. This proportion has increased, rising from 79% in 2022 to 83% by 2025. Meanwhile, environmental and personal ASB have gradually declined in proportion, indicating that everyday disturbance and noise-related issues are now the primary concern across our various communities.

Figure 3: Count of ASB by districts in Cambridgeshire between 2022 and 2025
Figure 3 details annual counts of ASB incidents by district between 2022 and 2025. The chart shows a steady rise in ASB across all districts between 2022 and 2025, with Cambridge consistently reporting the highest levels between 2022 and 2024. Huntingdonshire has seen the most notable growth, recording the highest count in 2025 compared to the other districts in Cambridgeshire.
Sources:
- How to report antisocial behaviour: Overview – GOV.UK
- ONS, 2026: Crime in England and Wales – Office for National Statistics
- The policing response to antisocial behaviour: PEEL spotlight report – His Majesty’s Inspectorate of Constabulary and Fire & Rescue Services
All of the relevant reports can be found below in the reports section as well as in the document library.