Local Population and Dwelling Stock Estimates and Forecasts
Cambridgeshire County Council’s locally produced population and dwelling stock estimates and forecasts are published here and are available for the five districts of Cambridgeshire: Cambridge City, East Cambridgeshire, Fenland, Huntingdonshire and South Cambridgeshire, as well as for Peterborough Unitary Authority.
Cambridgeshire County Council’s population and dwelling stock estimates are available for the Combined Authority, county, district / city council, electoral ward and parish boundaries. They present the most recent estimates of the size of the usual resident population and number of dwellings at mid-year. The estimates are produced using local data sources, such as health statistics, school rolls, electoral registers and housing completions data.
Cambridgeshire County Council’s population and dwelling stock forecasts are available for the Combined Authority, county, district / city council, and electoral ward boundaries, and extend to 2041. They use the most recent mid-year population and dwelling stock estimates as a starting point. The forecasts are ‘policy-led’, so that they are consistent with planned levels of house-building, informed by the most recent housing trajectories published by each local authority, with some interpolation and extrapolation by Cambridgeshire County Council. Recent historic demographic trends in births, deaths and migration are also taken into account in the population forecasts.
The mid-2024 population and dwelling stock estimates and 2024-based population and dwelling stock forecasts are the latest available.
This interactive dashboard presents Cambridgeshire County Council’s (CCC’s) mid-2022 to mid-2024 population estimates and 2024-based population forecasts for Cambridgeshire and Peterborough.
The population estimates and forecasts are available by Combined Authority, county, district / city council and electoral ward boundaries. The dashboard can be used to explore the population estimates and forecasts for mid-2022 to mid-2041 by local area and by different age groups across Cambridgeshire and Peterborough.
The dashboard uses the following data sources which are published on Cambridgeshire and Peterborough Insight:
- Cambridgeshire and Peterborough mid-2024 estimates
- Cambridgeshire and Peterborough 2024-based population forecasts.
For more information on the methodology used to produce the estimates and forecasts please see the Methodology note for CCC’s mid-2024 population and dwelling stock estimates and forecasts.
2024-based forecasts for Cambridgeshire
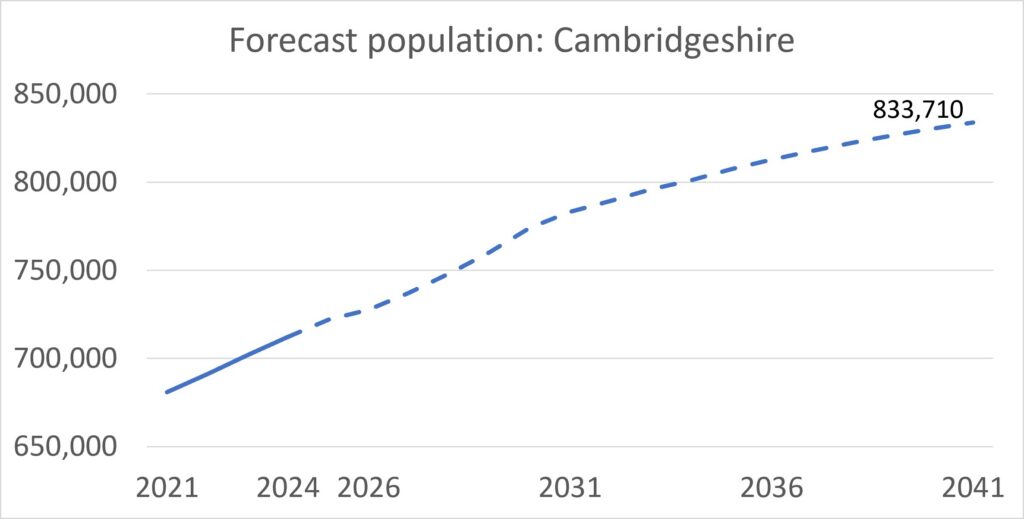
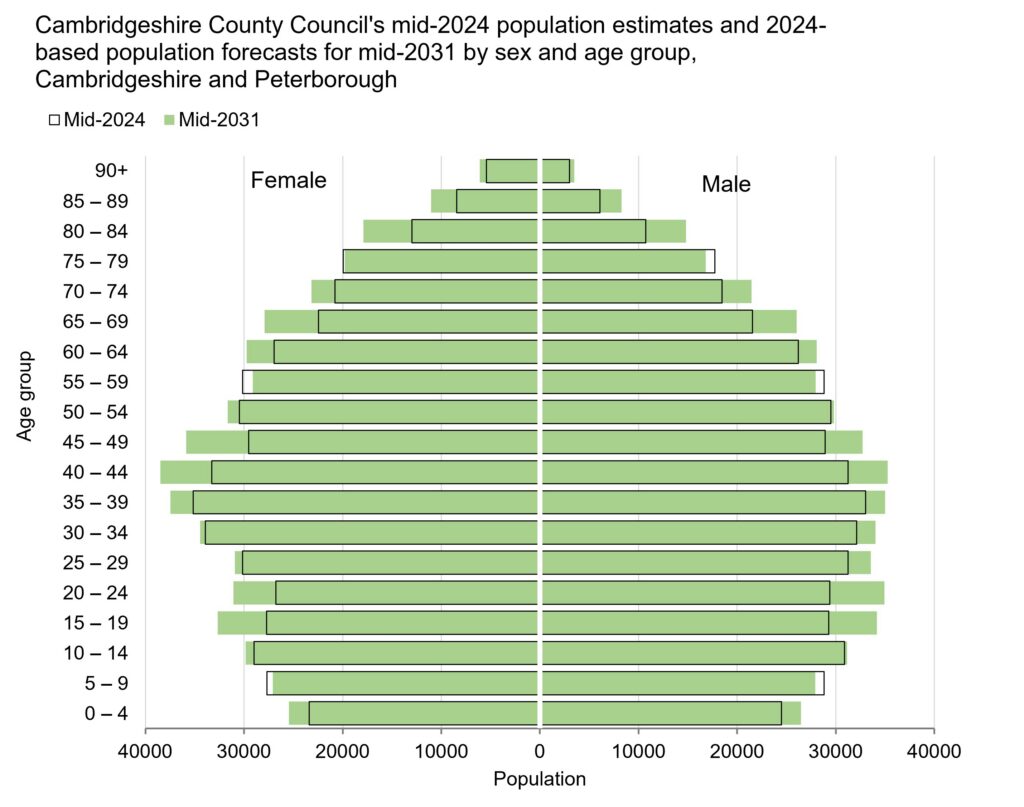
Cambridgeshire’s population is forecast to grow by an annualised average of 1.0% per year between mid-2024 and mid-2041. Population increase are forecast to be higher in the first part of the forecast period, with annualised average growth of 1.4% per year between mid-2024 and mid-2031. Overall, Cambridgeshire’s population is forecast to increase by 17.0% between mid-2024 and mid-2041, to reach a population of almost 834 thousand by mid-2041.
The 65 years and over age group is forecast strong percentage change growth, forecast to increase by 18.0 % between mid-2024 and mid-2031, and by just over a third between mid-2024 and mid-2041, an additional 49,475 people. Almost half of this growth is accounted for by those aged 80 years and over, forecast to rise by almost two-thirds, from the estimate of 38,065 in mid-2024 to 61,080 by mid-2041, a rise of 23,015 in this age group.
2024-based population forecasts by age group, Cambridgeshire
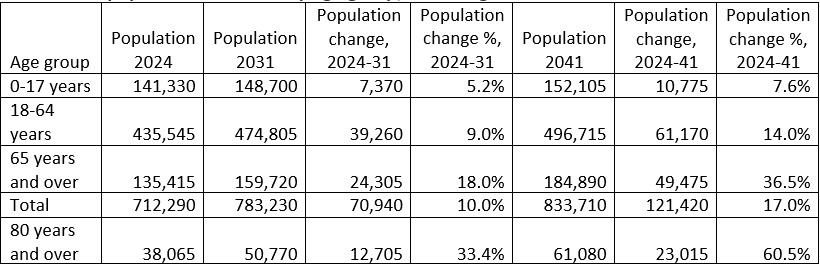
The effect of falling birth rates since 2015 contributes to the child population (0-17 years) seeing the smallest percentage growth over the forecast period, increasing by 7.6% between mid-2024 and mid-2041, an additional 10,775 children. The rise in numbers here is despite the recent trend of falling and lower birth rates and is driven by the significant levels of housing growth expected over the forecast period, particularly for major new developments.
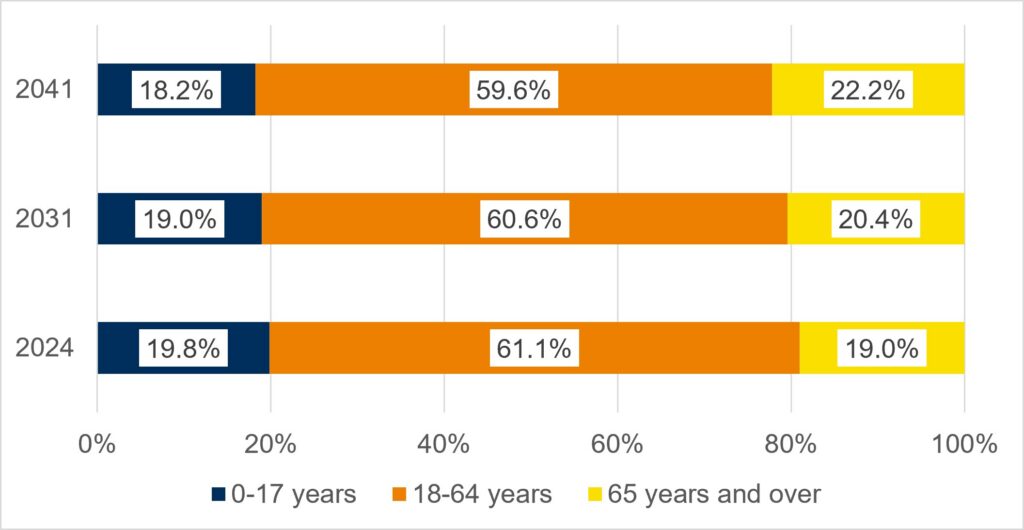
The population aged 18 to 64 years is forecast to grow by 14.0% by mid-2041, an additional 61,170 people. The proportion of the total population accounted for those aged 18 to 64 years is forecast to decrease from 61.1% in mid-2024 to 59.6% in mid-2041.The proportion of the population accounted for by children aged 0-17 years is forecast to fall from 19.3% of the population to 18.2% of the population by mid-2041. Meanwhile, the proportion of the population accounted for by those aged 65 years and over is forecast to rise from 19.0% of the population in mid-2024 to 22.2% of the population by mid-2041.
2024-based population forecasts, percentage of total population by age group, mid-2024, mid-2031 and mid-2041, Cambridgeshire
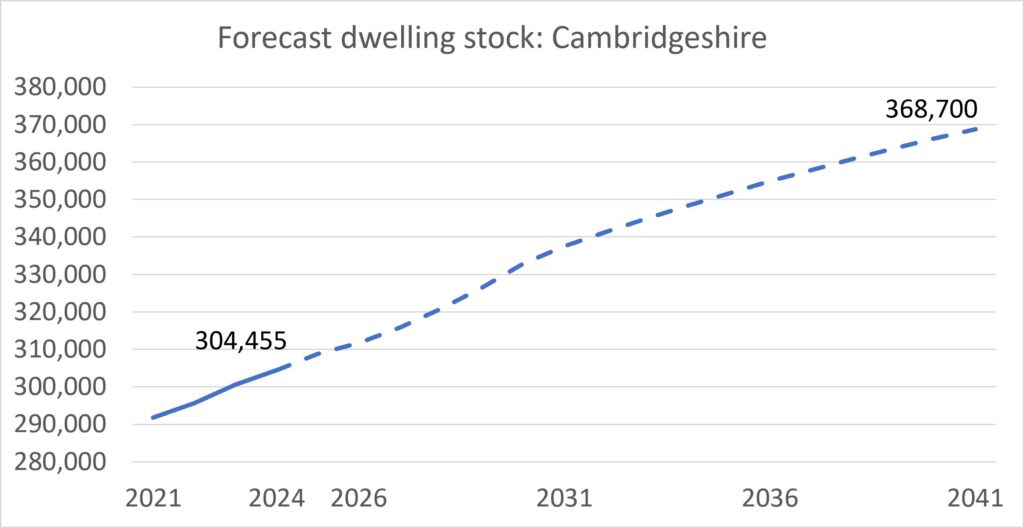
Almost 65 thousand new dwellings are forecast to be completed between 2024 and 2041 in Cambridgeshire, a rise in total dwelling stock of 21.1%.
2024-based forecasts for Cambridgeshire and Peterborough
For Cambridgeshire and Peterborough, population is forecast to grow by an annualised average of 0.9% per year between 2024 and 2041. Population increases are forecast to be higher in the first part of the forecast period, with annualised average growth of 1.3% per year between 2024 and 2031. Cambridgeshire and Peterborough’s population is forecast to grow by 16.0% between 2024 and 2041, to reach a population of approaching 1.1 million by 2041.

In Cambridgeshire and Peterborough just over 80 thousand new dwellings are forecast to be completed between 2024 and 2041, a rise in total dwelling stock of 20.3%. Some significant housing growth in Peterborough is expected with the continued development of The Hamptons as well as Great Haddon, where first completions were in 2023-24, as well as the development of Norwood, where first completions are currently expected in 2027-28.

2024-based population forecasts by local authority
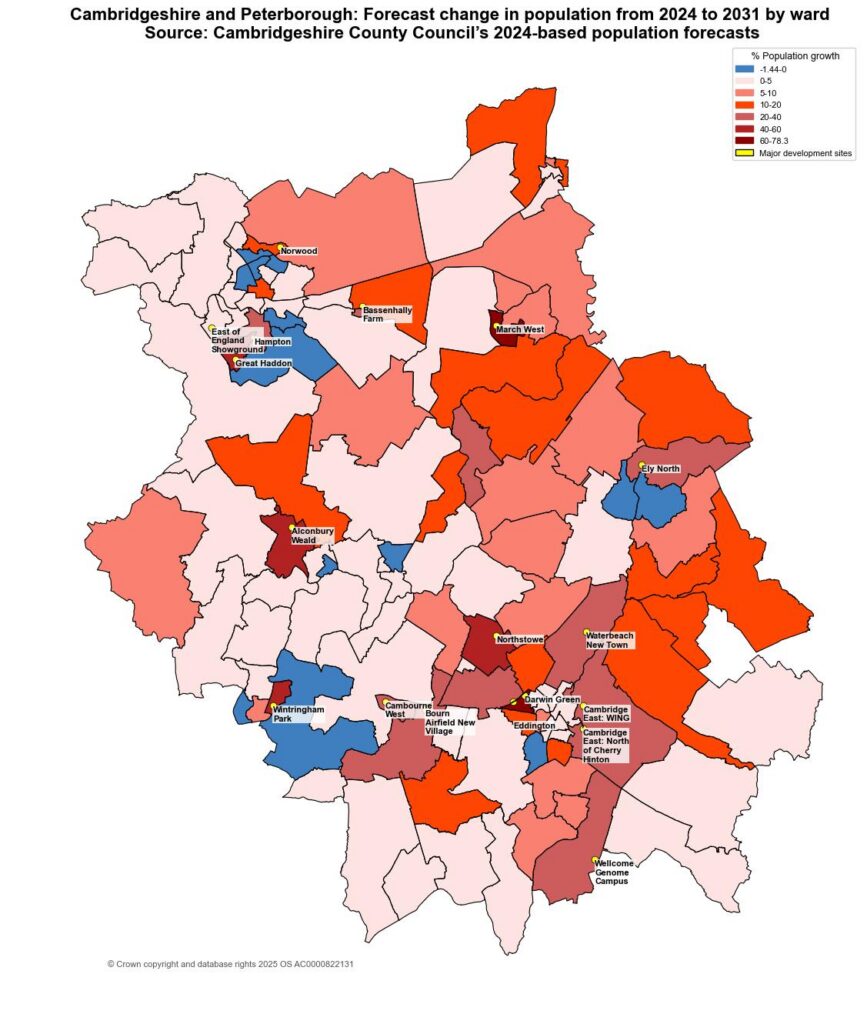
Population is forecast to grow across each of the district / city council areas. The population of Cambridgeshire is forecast to increase by more than 70 thousand residents between mid-2024 and mid-2031, and the population of Cambridgeshire and Peterborough by more than 85 thousand residents. By local authority, increases in population are forecast to range between 15 thousand more residents (in East Cambridgeshire and Fenland) and by just over 35 thousand residents (in South Cambridgeshire).

This population growth is driven by continued house building that is expected across the area. These include the continued growth of Eddington and Cambridge East in Cambridge City and South Cambridgeshire, Cambourne West, Northstowe and Waterbeach New Town in South Cambridgeshire, and Alconbury Weald and Wintringham Park in Huntingdonshire, along with the start of new settlements including Bourn Airfield New Village in South Cambridgeshire, and additional housing growth in market towns including Ely, Soham, and Littleport in East Cambridgeshire and Chatteris and March in Fenland.
Cambridgeshire and Peterborough: mid-2024 population and dwelling stock estimates and 2024-based population and dwelling stock forecasts
Cambridgeshire County Council’s mid-2024 population and dwelling stock estimates are available for districts, wards and parishes (based on 2024 boundaries). They present the most recent estimate of the size of the usual resident population and number of dwellings. These estimates are produced using data from Census 2021, mid-2022 and mid-2023 population estimates as well as local data sources, such as health statistics, school rolls, electoral registers and housing completions data.
Cambridgeshire County Council’s population and dwelling stock forecasts are available for districts and wards (based on 2024 boundaries) and extend to 2041. They use the most recent mid-year population and dwelling stock estimates as a starting point. The forecasts are ‘policy-led’, so that they are consistent with planned levels of house-building, informed by the most recent housing trajectories, at the time the forecasts are produced, published by each local authority, with some interpolation and extrapolation by Cambridgeshire County Council. Recent historic demographic trends in births, deaths and migration are also taken into account in the population forecasts.
Please refer to the methodology note for the mid-2024 estimates and 2024-based forecasts for further details.
Methodology note for CCC’s mid 2024 population and dwelling stock estimates and forecasts
Cambridgeshire and Peterborough Mid-2024 Estimates
2024-Based Population Forecasts
2024-Based Dwelling Stock Forecasts
Cambridgeshire and Peterborough: mid-2024 to mid-2031 population pyramids

Cambridgeshire and Peterborough: ward maps of population change 2024 to 2031
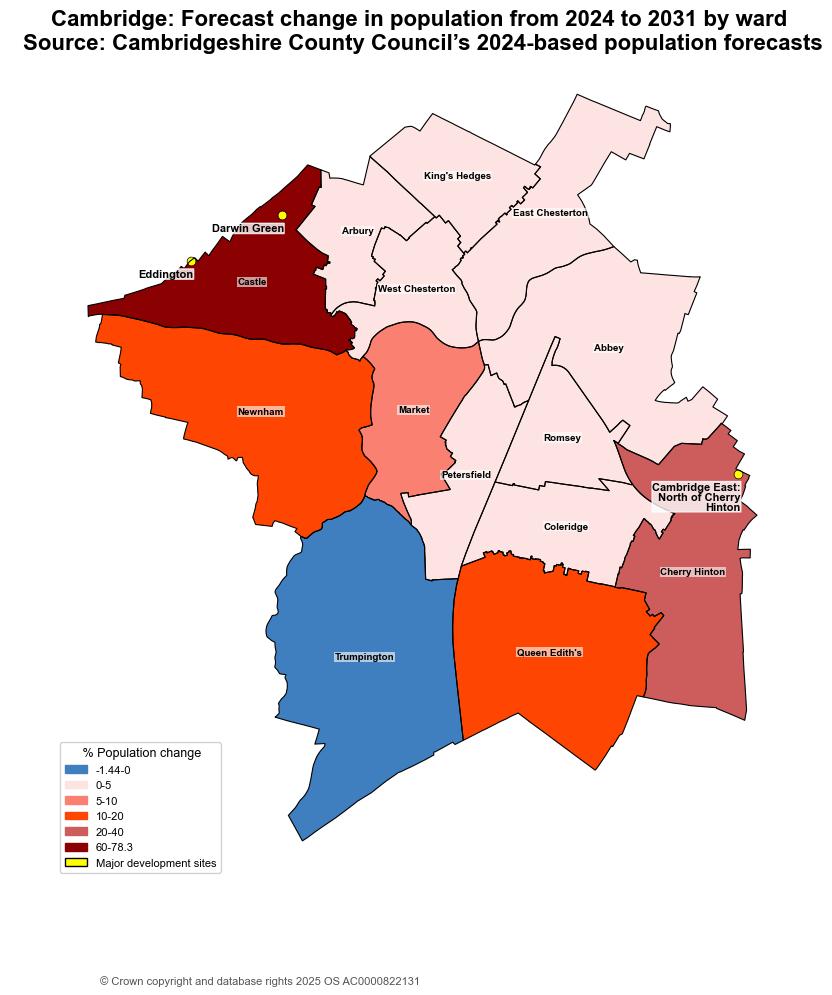
Overall, the population of Cambridge city is forecast to grow by 15,080 residents (10.0%) between mid-2024 and mid-2031.
Almost half (46.7%) of this overall growth is forecast to be in Castle ward. The population of Castle is forecast to increase by 78.3% over the period, driven by the continued development of Eddington and Darwin Green. Cherry Hinton ward, with housing development at Cambridge East, is forecast to have the second largest growth in population of just over one fifth (20.5%). King’s Hedges, Romsey and Trumpington wards are all forecast to see very little change in the overall size of their populations, with Trumpington forecast to experience a small fall, -100 people (-0.8%).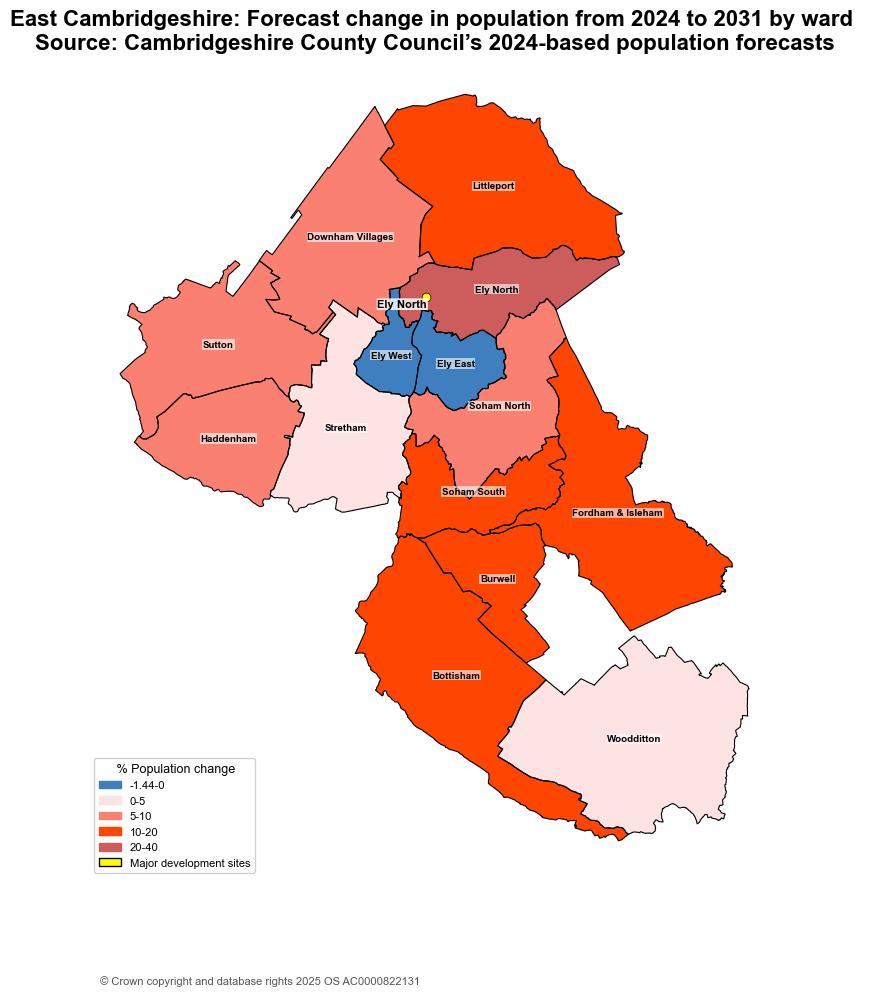
Overall, the population of East Cambridgeshire is forecast to grow by 9,740 residents (10.5%) between mid-2024 and mid-2031.
The ward of Ely North has the largest forecast growth in population by mid-2031 of 2,110 additional residents), a 10.5% increase compared to mid-2024. The growth in this ward forecast as a result of the continued build of the Ely North housing developments.
Ely East and Ely West wards, with little housing development expected, are forecast the lowest levels of population growth. Ely West is forecast a marginal fall in population of -75 residents (-0.8%), while Ely East is forecast no change in the size of the overall population between mid-2024 and mid-2031.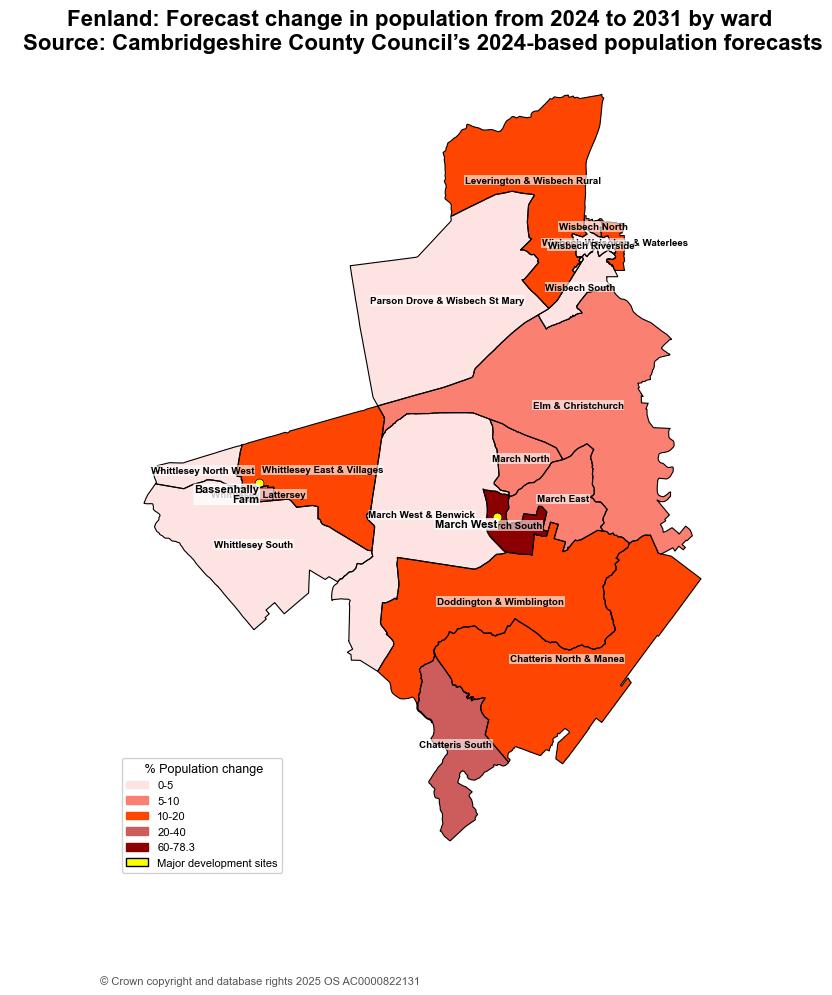
Overall, the population of Fenland is forecast to grow by 11,305 residents (10.7%) between mid-2024 and mid-2031.
The ward of March South is forecast the largest increase in population between mid-2024 and mid-2031, at 60.5%. The growth in this ward is forecast in part due to the commencement of build at the South-east March and West March strategic allocations. Chatteris South ( an additional 1,555 residents, 24.8%) and Whittlesey East & Villages (an additional 1,105 residents, 15.8%) are also forecast relatively strong population. Meanwhile, Whittlesey Lattersey is forecast notable population growth of 31.4%, 605 additional residents by mid-2031.
The ward of Wisbech Riverside is forecast to see the lowest levels of population growth (2.0%, 100 additional residents) by mid-2031.
Overall, the population of Huntingdonshire is forecast to grow by 10,365 additional residents (5.5%) between mid-2024 and mid-2031.
Almost one-third, 30.0% (3,100 additional residents) of this growth is forecast to be in The Stukeleys ward, as the housing development at Alconbury Weald continues to build out. St. Neots East ward is also forecast notable population growth of 44.6% (2,485 additional residents), as housing development at Wintringham Park continues.
St. Ives East (-1.4%), Yaxley (-0.9%), St. Neots Eatons (-0.6%), and Great Paxton wards (-0.2%) are all forecast a marginal fall in the size of their populations by mid-2031.
Overall, the population of South Cambridgeshire is forecast to see the largest increase in population of all the district / city council areas in Cambridgeshire and Peterborough between mid-2024 and mid-2031, with growth of 24,450 additional residents (14.1%) forecast.
As Northstowe continues to build out, Longstanton ward is forecast the largest increase in population, with growth of 54.8% increase (4,945 additional residents) by mid-2031. Close behind, the ward of Milton and Waterbeach is forecast an additional 4,345 residents (38.4% growth) by mid-2031 as Waterbeach New Town develops. Caldecote ward, where Bourn Airfield New Village will start to be built from 2026-27, is also forecast notable population growth of 29.3%, an additional 1,225 residents, by mid-2031. The wards of Cambourne (3,340 additional residents, 24.9% growth) and Fen Ditton and Fulbourn (2,705 additional residents, 23.7%) are also forecast notable population growth, as new housing at Cambourne West and Cambridge East is developed.
There are no wards in South Cambridgeshire forecast to see a fall in total population.
Overall, the population of Peterborough is forecast to grow by 14,930 additional residents (6.7%) between mid-2024 and mid-2031.
Almost one-third (30.6%) of this growth is forecast to be in the Hampton Vale ward, and Hargate and Hempsted ward accounts for another 23.3% of this growth. The new development of Great Haddon and continued build of The Hamptons contribute to forecast population growth of 50.0%, 4,570 additional residents, in Hampton Vale ward and growth of 23.8%, 3,480 additional residents, in Hargate and Hempsted ward by mid-2031. The development of Norwood, where first completions are currently expected in 2027-28, will also see the population of Gunthorpe ward increase, by a forecast 10.9% (1,085 additional residents) by mid-2031.
The wards of Stanground South (-1.3%), Ravensthorpe (-0.7%), Dogsthorpe (-0.5%), and North (-0.5%) are all forecast to see a small fall in the overall size of their population between mid-2024 and mid-2031.
Cambridgeshire and Peterborough estimates and forecasts: previously published datasets
Earlier publications of Cambridgeshire County Council’s population and dwelling stock estimates and population and dwelling stock forecasts are available under the population section of the document library.
Historic Population
Importance of historic population records
The Census in the UK has been conducted every 10 years since 1801. Over this time there have been numerous changes to the administrative boundaries, such as the amalgamation and deletion of wards and parishes, or the creation of new ones. These occur for a range of reasons, but usually to better distribute the population for administrative purposes.
Without knowledge about boundary changes it can be difficult to understand changes observed in populations, or make comparisons of areas over time. For example, moving a parish boundary may cause a population to increase on paper, within a given parish, but only because part of the population of a neighbouring parish has been incorporated, and not because a sudden influx of new residents.
The full dataset can be found on our Open Data Portal.
Local records
Cambridgeshire County Council have tried to keep a record of the changes to parishes over time, and the estimated populations as published by each Census, since 1801. This way we are better able to explain apparent changes to the populations estimated by each Census. You will find the most up to date versions of these records on our Open Data Portal.
Interactive Report
Use the drop down menus above to select between different wards and districts.