Poverty and Financial Insecurity
Poverty and financial insecurity have a significant impact on material living conditions and stress, and as a result, are strong risk factors for mental illness.
Why is poverty important to mental health?
- Poverty is when a person’s resources ‘are not sufficient to meet their minimum needs’ (18). This prevents people from heating their homes, buying nutritious food and participating in social activities; and the resultant stress is a strong causal factor for poor mental health (19).
- Almost three quarters (73%) of people living on an income below £300 a week have experienced a mental health problem, compared to 59% of people earning over £925 a week (20).
- The poorest 20% of the population is twice as likely to develop mental health problems as those on an average income (4).
- Children in families with a gross weekly household income of under £100 are over 3 times as likely to be diagnosed with a mental health condition than those with an income of £600 or above (21).
- Growing up in poverty can have long-term impacts on children’s health, by hindering their cognitive, social and emotional development, as well as their behavioural outcomes (22).
- On top of this, people with mental health conditions can be affected by a ‘spiral of adversity’, whereby their employment, income and relationships are negatively impacted by their condition (4). This can have a detrimental impact on their mental health and trap them in poverty.
- For example, qualitive research involving older adults living in poverty highlights that this group struggles to meet their basic needs, such as heating their home and having a social life, which can leave them feeling helpless, anxious and overwhelmed (135).
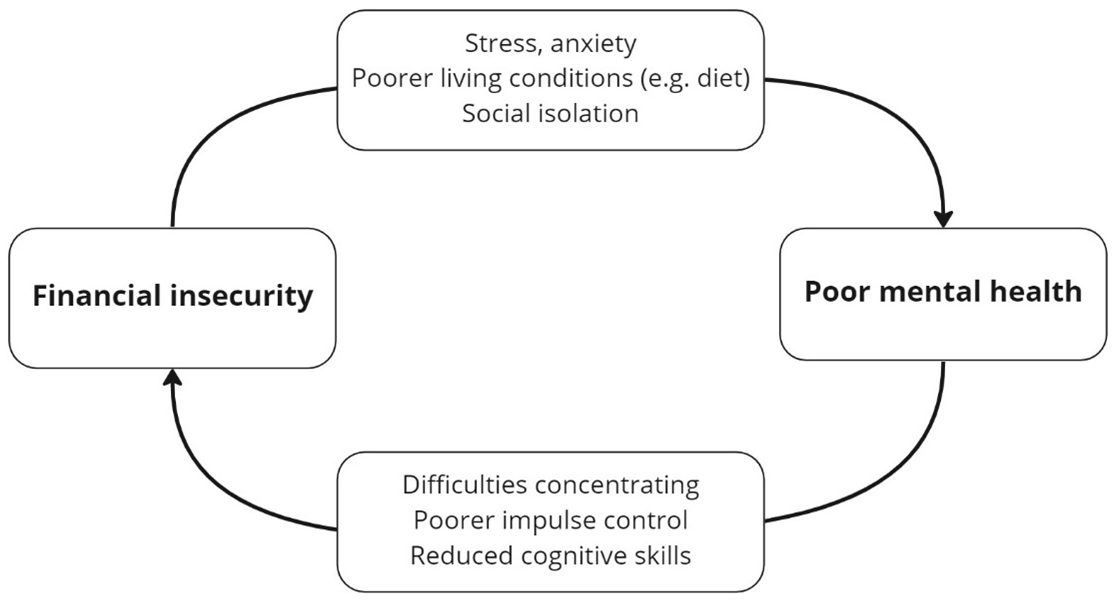
Figure 7: Spiral of poor mental health and financial insecurity
- International research shows that whilst a loss of income can cause mental illness, antipoverty programmes and cash transfers can reduce common mental health conditions (143).
Lived experience: Barbara story Navigating debt and mental health (source CAB Cambridge City)
Lived experience: Donald story The ‘Spiral of Adversity’ in Practice (source CAB Cambridge City)
Financial insecurity
- Increasing numbers of people are affected by financial insecurity, with significant impacts on mental health. Worrying about paying the bills can exacerbate pre-existing mental health problems.
- Children and young people are also likely to be affected: being aware of family financial struggles as a teenager has a negative impact on mental health and is associated with harmful drinking patterns and depression (23).
- The relationship between financial insecurity and mental health can be bidirectional, as the psychological and cognitive impacts of mental health conditions can make it more difficult for people to manage their finances (24).
- People with mental health conditions who contact Citizens Advice face more problems with meeting their basic needs, such as housing, than those without mental health conditions.
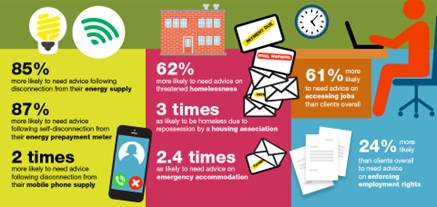
Figure 8: Amongst people who contact Citizens Advice, how do people with mental health conditions compare to people who do not have mental health conditions? Source: Public Health England 2020
Fuel poverty
- Fuel poverty is associated with poor mental health in both adolescents and adults (25,26).
- Households living in fuel poverty often ration or turn off their heating. Living in a cold home is linked to many wider determinants of poor mental health, including reduced school performance and absences from work (27).
Food insecurity
- Food insecurity, a lack of reliable access to affordable and nutritious food (28), is associated with stress and depression (29), and had been associated with eating disorders, particularly binge-eating disorder and bulimia (30).
- Food insecurity is also linked to unhealthy diets and poor general health (31).
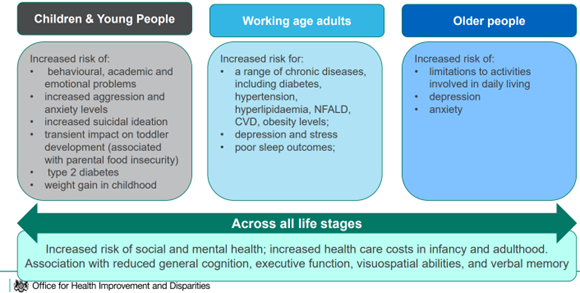
Figure 9: Food insecurity as a Public Health issue. Source: OHID
Debt
-
- Compared to people without personal loans, people with unsecured debt are (32):
- 3 times as likely to have a mental health problem
- 7 times as likely to die by suicide
- 9 times as likely to have a drinking problem
- There is a strong two-way relationship between mental illness and debt: research from the debt charity StepChange shows that a high proportion (39%) of people who sought support from them in 2021 had a mental health condition (33).
- Compared to people without personal loans, people with unsecured debt are (32):
What is the national picture?
-
- Wider structural inequalities mean that some groups are more likely to be in poverty, including:
- Refugees, asylum seekers and refused asylum seekers (34).
- Certain ethnic groups: households where the head of the household is Pakistani or Bangladeshi are significantly more likely to live in poverty than those from White ethnic groups (35).
- Renters: 46% and 33% of social and private renters live in poverty, compared to 15% of those who own their house and 11% who have a mortgage (35).
- Disabled people: half of all people in poverty are disabled or live in a family that includes a disabled person, compared to 36% of those who do not live in poverty (36).
- National data shows 1 in 4 adults aged between 60 and 64 lived in poverty in 2022, the highest rate for any adult age group (Centre for Ageing Better, 2023b). 18% of pensioners live in relative poverty, with groups at greater risk including private tenants (37%) and people living in social housing (36%); Asian/Asian British (29%) and Black/Black British pensioners (25%); and single older women (26%) (Age UK, 2023).
Financial insecurity
- The cost of living has been rising in the UK since the mid-2000s (37), whilst wages have stagnated (38). There is currently a recognised cost of living crisis in which many low-income households are having to choose between having enough food or heating their homes (39).
- Some households are disproportionately likely to be unable to afford essentials, particularly (39):
- Black, Asian and mixed ethnicity households.
- Lone parent or large families.
- Households were everyone is of working-age.
Fuel poverty
- Increases in fuel prices have led to dramatic increases in rates of fuel poverty, with recent predictions suggesting that 2 in 3 UK households will be in fuel poverty by January 2023 (40).
- Gypsy and Traveller communities who live in mobile homes and caravans are likely to be disproportionately impacted by rises in fuel costs (41).
Food insecurity
- Over 1 in 10 (13.8%) of all UK households, and 43% of households receiving Universal Credit, experienced food insecurity in April 2022 (42).
- Non-white ethnic groups, lone parent families and people with disabilities are disproportionately likely to experience food insecurity (42,43).
Debt
An increasing number of people are likely to enter unsecured and problematic debt over the coming months as a result of the cost of living crisis (42)
What is the local picture?
- Several areas within Peterborough and Fenland are in the highest national quintile (20%) for low-income deprivation (44).
- This measure captures people who are unemployed, unable to work due to disability or caring responsibilities and those in low paid employment.
- The mean income of men in Peterborough is significantly below the national average, whilst for Cambridgeshire mean income is above average (44).
- The mean income of women in both C & P was close to the national average in 2021 (44).
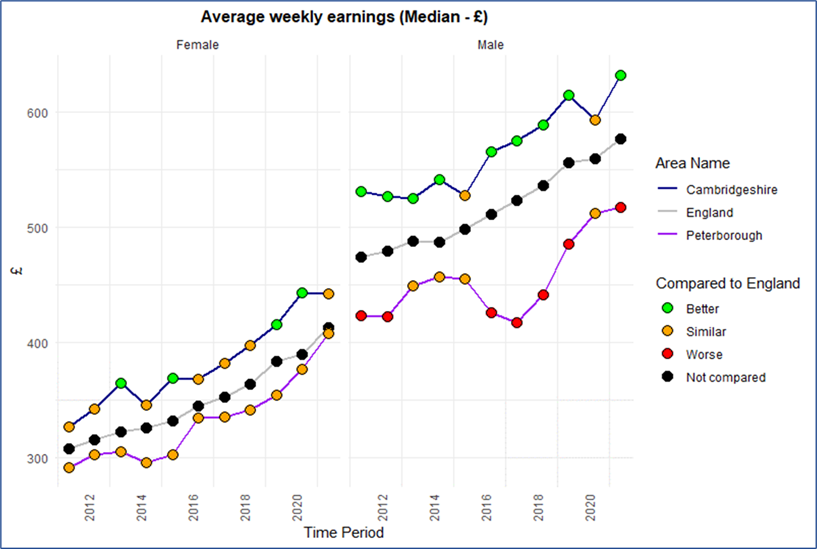
Figure 10: Median weekly earnings in C & P over time. Data source: (44)
- Over a quarter of children (under 16s) in Peterborough live in low-income families (44). This is significantly higher than both the national average and the rate in Cambridgeshire.
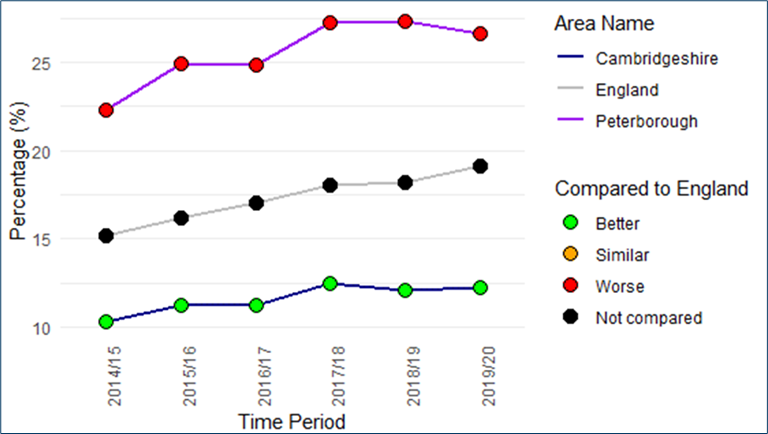
Figure 11: The proportion of children (under 16s) in relative low-income families over time. Data source: (44)
- The proportion of children living in poverty in Peterborough (36%) and Fenland (31%) is higher than most areas in East of England region; whilst East Cambridgeshire (18%) and South Cambridgeshire (17%) have relatively low rates child poverty rates (45).
- Note that these are estimated child poverty rates which take housing costs into account.
- In real terms, wages have decreased by 5% in Cambridge city and 4.9% in Peterborough city since May 2021(46).
- As a result, workers in Cambridge are on average £180 a month, and in Peterborough £110 a month, poorer in July 2022 than in the previous year (46).
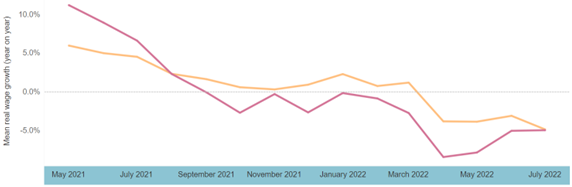
Figure 12: Mean real wage growth in Cambridge and Peterborough cities. Source: Centre for Cities 2022
- There have been increases in the proportion of people claiming Universal Credit across the whole of C&P. The largest increase has been in Peterborough.
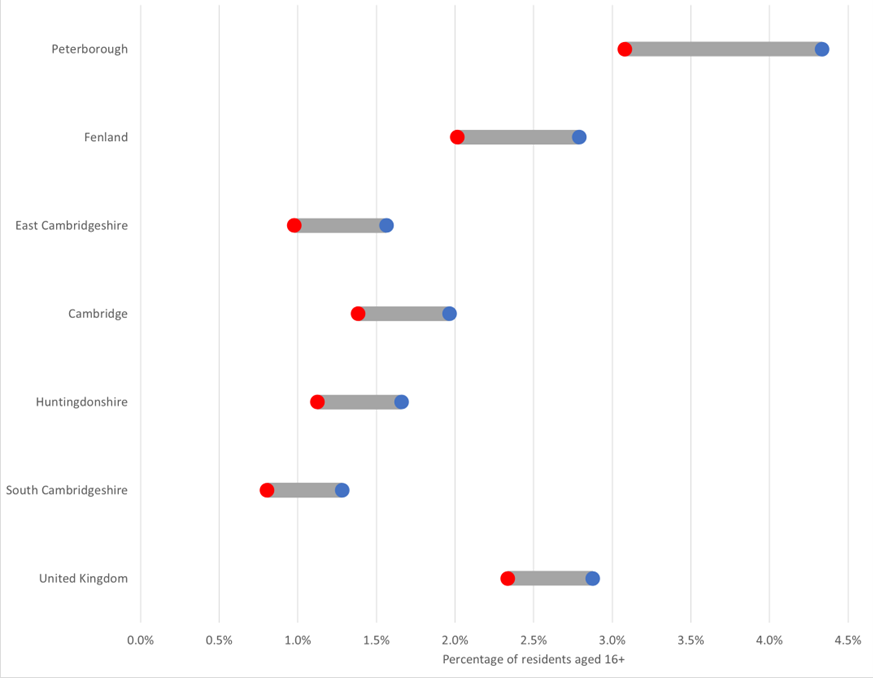
Figure 13: Change in the proportion of adults (aged 16+) claiming Universal Credit from March 2020 (shown as the red dot) to June 2022 (shown as the blue dot). Source: Cambridgeshire County Council 2022
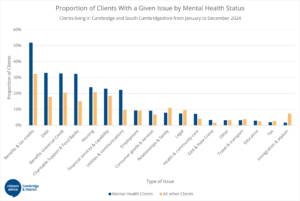
Figure 14: Produced by the Cambridge CAB, the graph below shows the Proportion of Clients With a Given Issue by Mental Health Status:
Fuel poverty
- Around 12.3% of households in Cambridgeshire and 14.9% in Peterborough were living in fuel poverty in June 2020 (47), however this proportion is likely to have risen significantly since then.
- In October 2022, the estimated annual energy bill was (46):
- £2380 in Cambridge city, a £504 increase compared to the previous period (April to September 2022).
- £2358 in Peterborough city, a £499 increase compared to the previous period (April to September 2022).
A wellbeing survey conducted by the Peterborough based environmental charity PECT showed that among those requesting home energy support reveals a significant prevalence of “Depression/stress,” highlighting the potential mental health consequences of these hardships: PECT WELLBEING SURVEY RESULTS PDF
Food insecurity
- Several locations in Cambridge have been identified as ‘food deserts’, which are poorly served by food outlets. This is a geographic risk factor for food insecurity (48).
Poverty Commission
The Cambridgeshire Poverty Strategy Commission is an independent group of commissioners dedicated to addressing the complex issue of poverty in Cambridgeshire. The group were established and supported through extensive partnership work across public and voluntary sectors. Their work began in October 2024 and published its final report in May 2025. Their aim was to understand how poverty impacts residents and to find ways to create lasting change.
Additional resources
- The local data pack gives an overview of key data and trends
- NIHR’s summary of the importance of income, the welfare system and wider economic conditions to public mental health
- The Royal College of Paediatrics and Child Health spoke to 500 children and young people across the UK to understand what might stop them healthy, healthy and well and what could make a positive difference to their lives, the key themes from which were summarised in a letter
- How poverty drives child health inequalities
- UK Poverty 2026: The essential guide to understanding poverty in the UK | Joseph Rowntree Foundation
- Not a secondary issue: Preventing and resolving financial difficulties for people in secondary mental health care
- The Health Foundation’s Evidence Hub on money and resources
- Money and mental health: key facts
- A review highlighting the relationship between poverty and mental health
- A dual crisis: The hidden link between poverty and children’s mental health
- King’s Fund report Poverty and the health and care system: The role of data and partnership in bringing change
- The Joseph Rowntree Foundation reports: UK Poverty 2022 and Not heating, eating or meeting bills: managing a cost of living crisis on a low income
- The cost of living crisis and the nation’s mental health
- How do income changes impact on mental health and wellbeing for working-age adults? A systematic review and meta-analysis
- Local anti-poverty strategies
- Poverty stigma: a glue that holds poverty in place
- Kings Fund Relationship between Poverty and NHS Services
- Poverty and mental health | Mental Health Foundation
References
Full list of references can be found here
18. Joseph Rowntree Foundation, Goulden C, D’Arcy C. A definition of poverty. JRF Programme Paper. 2014.
- Benzeval M, Bond L, Campbell M, Egan M, Lorenc T, Petticrew M, et al. How does money influence health? Joseph Rowntree Foundation. 2014;
- Mental Health Foundation. Surviving or Thriving? The state of the UK’s mental health [Internet]. 2017 [cited 2022 Oct 3]. Available from: https://www.mentalhealth.org.uk/sites/default/files/2022-06/surviving-or-thriving-state-uk-mental-health-publication.pdf
- Green H, McGinnity A, Meltzer H, Ford T, Goodman R. Mental health of children and young people in Great Britain, 2004. Vol. 14, Child and Fa. 2009.
- Treanor MC. Impacts of poverty on children and young people. Scottish Child Care and Protection Network (SCCPN). 2012;
- Fröjd S, Marttunen M, Pelkonen M, von der Pahlen B, Kaltiala-Heino R. Perceived financial difficulties and maladjustment outcomes in adolescence. Eur J Public Health. 2006;16(5).
- Holkar M. Seeing Through the Fog [Internet]. 2017 [cited 2022 Oct 4]. Available from: http://www.moneyandmentalhealth.org/wp-content/uploads/2017/02/Seeing-through-the-fog-Final-report-1.pdf
- Liddell C, Morris C. Fuel poverty and human health: A review of recent evidence. Energy Policy. 2010;38(6).
- Liddell C, Guiney C. Living in a cold and damp home: Frameworks for understanding impacts on mental well-being. Vol. 129, Public Health. 2015.
- Akinwale B, Boardman B, Bone A, Boohan W, Buck D, Carmichael K, et al. Local action on health inequalities: Fuel poverty and cold home-related health problem. 2014.
- The Food Foundation. Food Insecurity Tracking [Internet]. 2022 [cited 2022 Sep 2]. Available from: https://www.foodfoundation.org.uk/initiatives/food-insecurity-tracking
- Pourmotabbed A, Moradi S, Babaei A, Ghavami A, Mohammadi H, Jalili C, et al. Food insecurity and mental health: A systematic review and meta-analysis. Vol. 23, Public Health Nutrition. 2020.
- Becker CB, Middlemass K, Taylor B, Johnson C, Gomez F. Food insecurity and eating disorder pathology. International Journal of Eating Disorders. 2017;50(9).
- Yau A, White M, Hammond D, White C, Adams J. Socio-demographic characteristics, diet and health among food insecure UK adults: Cross-sectional analysis of the International Food Policy Study. Public Health Nutr. 2020;23(14).
- Richardson T, Elliott P, Roberts R. The relationship between personal unsecured debt and mental and physical health: A systematic review and meta-analysis. Vol. 33, Clinical Psychology Review. 2013.
- StepChange. Statistics Yearbook: Personal debt in the UK January – December 2021 [Internet]. 2022 [cited 2022 Oct 4]. Available from: https://www.stepchange.org/Portals/0/assets/infographic/StepChange-Statistics-Yearbook-2021.pdf
- Allsopp J, Sigona N, Phillimore J. Poverty among refugees and asylum seekers in the UK An evidence and policy review. IRiS Working Paper Series. 2014;
- Francis-Devine B. Poverty in the UK: statistics [Internet]. House of Commons Library. 2022 [cited 2022 Sep 2]. Available from: https://commonslibrary.parliament.uk/research-briefings/sn07096/
- Stroud P. Measuring Poverty 2020: A report of the Social Metrics Commission [Internet]. 2020. Available from: www.li.com
- Office for National Statistics. Consumer price inflation, UK: August 2022 [Internet]. 2022 [cited 2022 Oct 5]. Available from: https://www.ons.gov.uk/economy/inflationandpriceindices/bulletins/consumerpriceinflation/august2022
- Office for National Statistics. Average weekly earnings in Great Britain: September 2022 [Internet]. 2022 [cited 2022 Oct 5]. Available from: https://www.ons.gov.uk/employmentandlabourmarket/peopleinwork/employmentandemployeetypes/bulletins/averageweeklyearningsingreatbritain/september2022
- Earwaker R, Schmuecker K. Not heating, eating or meeting bills: managing a cost of living crisis on a low income [Internet]. 2022 [cited 2022 Sep 2]. Available from: https://www.jrf.org.uk/report/not-heating-eating-or-meeting-bills-managing-cost-living-crisis-low-income
- Lee A, Sinha I, Boyce T, Allen J, Goldblatt P. Fuel poverty, cold homes and health inequalities. 2022.
- Mann S, O’Driscoll J, MacNamara Y, Cannon V, Kennett D, Cooper R. Re: Energy cost crisis and the impact on Gypsies and Travellers [Internet]. Friends, . 2022 [cited 2022 Oct 5]. Available from: https://www.gypsy-traveller.org/wp-content/uploads/2022/08/Business-and-Energy-letter.pdf
- Barry A, Brook P, Cebula C, Collingwood A, Drake B, Elliott J, et al. UK Poverty 2022. 2022.
- The Food Foundation. Food Insecurity Tracking [Internet]. 2022 [cited 2022 Oct 4]. Available from: https://foodfoundation.org.uk/initiatives/food-insecurity-tracking
- Office for Health Improvement and Disparities. Wider Determinants of Health [Internet]. Fingertips. 2022 [cited 2022 Oct 4]. Available from: https://fingertips.phe.org.uk/profile/wider-determinants
- Stone J. Local indicators of child poverty after housing costs, 2020/21. 2022.
- Centre for Cities. Cost of living tracker [Internet]. 2022 [cited 2022 Nov 28]. Available from: https://www.centreforcities.org/data/cost-of-living-tracker/
- Office for Health Improvement and Disparities. Local Health [Internet]. 2022 [cited 2022 Oct 4]. Available from: https://localhealth.org.uk/
- Fenn S. Food Deserts and Food Swamps in Cambridge. 2019.