Education and Life-long Learning
Education is an important determinant of health and wellbeing across the life-course. It can improve peoples’ life chances, increase their ability to access healthcare and enables them to live healthier lives (4).
Why is education important to mental health?
- Educational outcomes are strongly tied to employment opportunities, economic circumstances and thus overall health and quality of life (4). Educational levels are also linked with health behaviours (63,64).
- As such, educational attainment can be an important protective or risk factor for mental health.
- Young people with mental health problems can find it difficult to achieve their full potential at school. This can disrupt their educational attainment and reduce their ability to enter employment (65).
- Some educational outcomes are closely intertwined with existing inequalities like deprivation (66) and can therefore compound poor mental health.
School exclusions
- School exclusions exemplify the bidirectional relationship between school performance and mental health. Being excluded from school is associated with increased rates of psychological distress (67); and almost all children who are excluded from school have some form of mental health condition (68).
- Three quarters (77%) of children excluded from school have recognised special educational needs or disability (68).
- School exclusions have long-term impacts on the life chances of young people: just 1% of excluded pupils achieve 5 passes at GCSEs level including English and Maths, which limits their progression to university and employment (68).
Adult learners
- Beyond school and higher education, participation in adult learning is linked with good wellbeing (69) and can protect against age-related cognitive decline (4).
- Some evidence suggests adult learning has direct positive impacts on mental health, alongside indirect benefits from improving employment outcomes and health behaviours (70).
- Community adult education programmes have been used as social prescribing for mild/moderate anxiety and depression due the mental health benefits of social connection and taking part in activities (4).
What is the national picture?
- Pre-existing educational inequalities across all age groups have been exacerbated by the COVID-19 pandemic (71,72).
Primary school
- When children begin primary school, there is a strong socioeconomic gradient in the proportion of those who are ‘school ready’ (this refers to children reaching the expected level of development for their age group).
- 92% of children who do not meet expectations in English and Mathematics at the end of primary school, do not pass English and Mathematics GCSE (73), and thus face significant challenges when entering employment.
GCSEs
- There are significant inequalities in attainment 8 scores linked to ethnicity and free school meal eligibility (children are eligible for free school meals if their parents are in receipt of certain benefits, hence this identifies children in out-of-work and many low income households) (74).
- Mean attainment 8 scores are calculated by adding together pupils’ highest GCSE scores (measured from 1 to 9, where 9 is the highest grade), across 8 government approved school subjects.
- Children are eligible for free school meals have lower attainment 8 scores than those who are not eligible, across all ethnic groups. Children from Gypsy/Roma ethnic groups have the lowest attainment 8 scores (74).
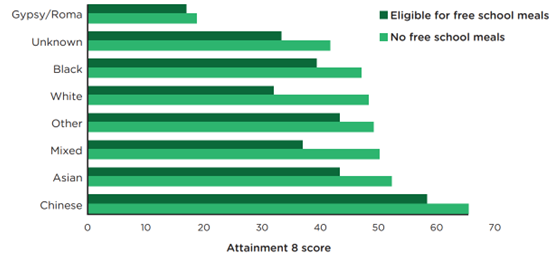
Figure 18: Average Attainment 8 score, by ethnicity and free school meal eligibility. Source: Marmot 2020
School exclusions
- Children from Black Caribbean ethnic groups and Gypsy, Roma and Irish Traveller children are more likely to be excluded from school than the general population (75).
- Children who currently receive free school meals (FSM current) or have received free school meals in the past year are also more likely to be excluded (FSM ever6).
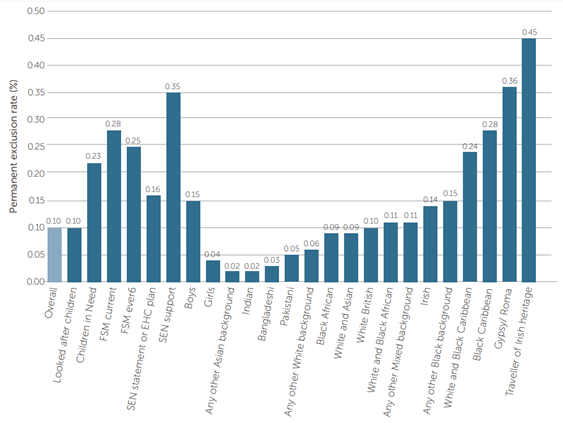
Figure 19: Permanent exclusion rates by pupil characteristic. Source: Timpson 2019
University progression
- There are substantial inequalities in the proportion of young people who progress to university. At a national level, just 28% of young people eligible for free school meals (FSM) entered higher education in 2021, compared to 47% of their non-FSM peers (73).
- This disparity is likely to have long-term impacts on the life opportunities of young people. People without a university degree are more likely to become trapped in poverty: 4 in 10 of working-age adults with no qualifications (below GCSE) are living in poverty, compared to 1 in 10 with a degree (42).
Adult learners
- Rates of adults participating in adult education have remained stable over the last few years (76).
- People who are already highly qualified are most likely to participate in adult learning. For example, people in managerial or professional jobs are twice as likely to participate in learning after completing full-time education than those in unskilled or casual work (77).
What is the local picture?
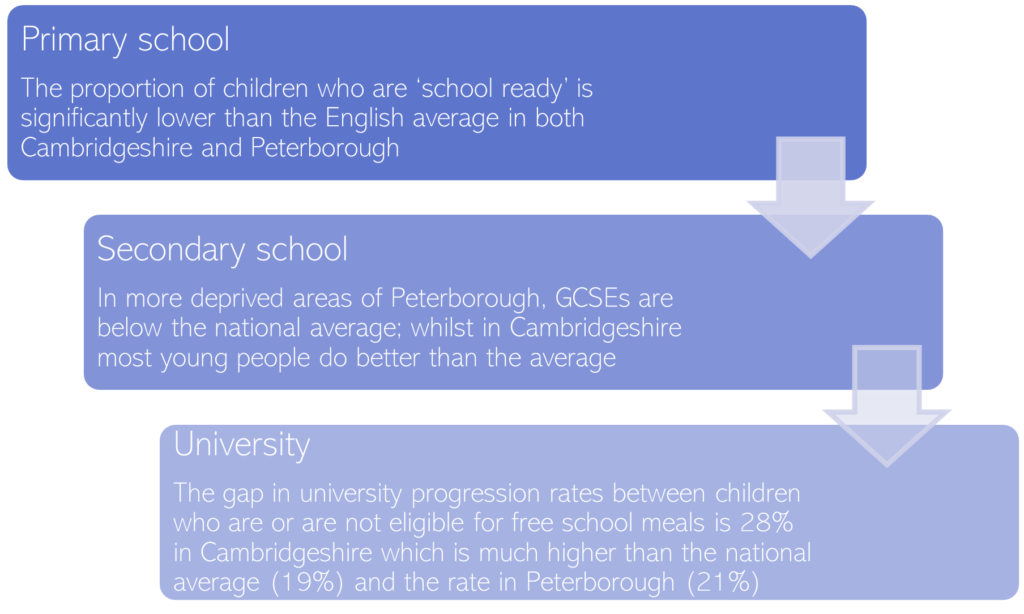
Figure 20: Educational outcomes across Cambridgeshire & Peterborough
Primary school
- The proportion of children who are ‘school ready’ is significantly lower than the English average in Cambridgeshire and Peterborough (44).
GCSE
- At GCSE level, there are disparities in attainment 8 scores across C & P.
- Mean attainment 8 scores are calculated by adding together pupils’ highest GCSE scores (measured from 1 to 9, where 9 is the highest grade), across 8 government approved school subjects, and dividing this total by 8.
- Fenland, Peterborough and Huntingdonshire have lower scores than average, whilst in most areas across Cambridgeshire young people do better than the national average (2).
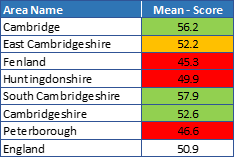
Figure 21: Average Attainment 8 scores in Cambridgeshire & Peterborough. Data source: (2)
- For children in care, the pattern is reversed: the average 8 attainment score of these children in Cambridgeshire is lower than the national average, whilst it has been higher than average in Peterborough for the last 2 years (2).
School exclusions
- Pre-pandemic data shows that exclusion rates in Peterborough were twice the national average, whereas in Cambridgeshire they were significantly below (78).
University progression
- Young people who are eligible for free school meals are less likely to progress to university than the rest of their classmates.
- The gap in university progression rates between young people who are and are not eligible for free school meals is much larger in Cambridgeshire (28%) than the national average (19%) or rates in Peterborough (21%) (79).
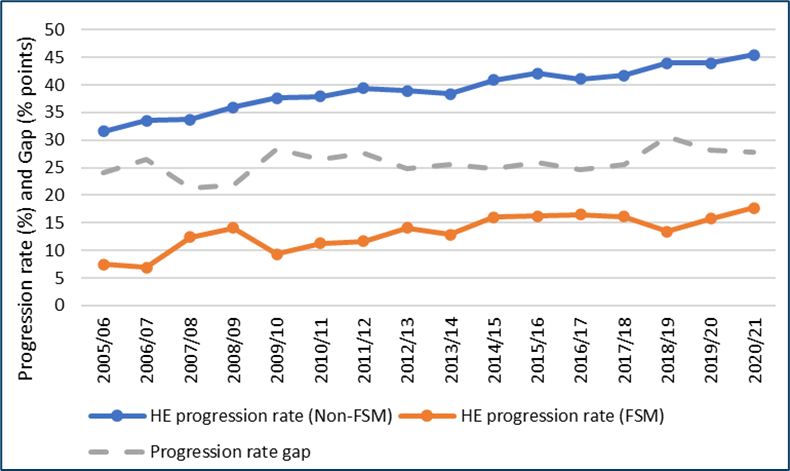
Figure 22: University progression rates for pupils who are/are not eligible for free school meals (FSM), in Cambridgeshire. Data source: (79)
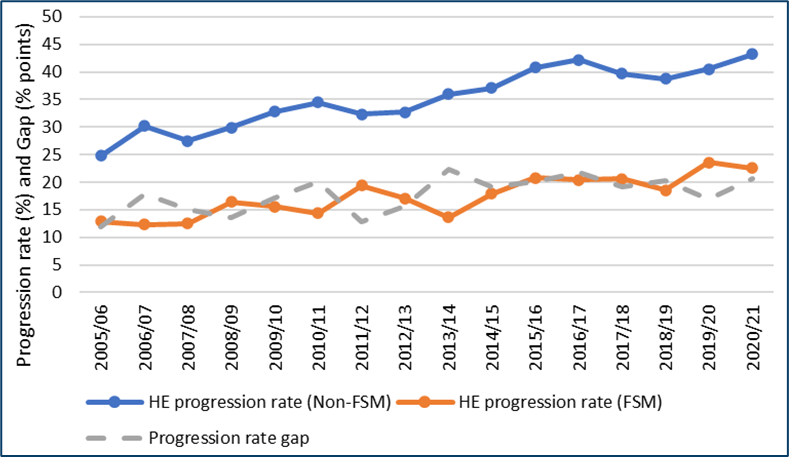
Figure 23: University progression rates for pupils who are/are not eligible for free school meals (FSM), in Peterborough. Data source: (79)
Additional resources
- The local data pack gives an overview of key data and trends
- NIHR’s summary of the importance of education to public mental health
- The Differences’ report Making The Difference: Breaking the link between school exclusion and social exclusion
- Further local data on early learning and educational attainment
- The most recent national survey on adult learners: Adult Participation in Learning Survey 2019
References
Full list of references can be found here
- Steptoe A, Wardle J. Motivational Factors AS Mediators of Socioeconomic Variations in Dietary Intake Patterns. Psychol Health. 1999;14(3).
- Pill R, Peters TJ, Robling MR. Social class and preventive health behaviour: A British example. J Epidemiol Community Health (1978). 1995;49(1).
- Elliott I. Poverty and Mental Health: A review to inform the Joseph Rowntree Foundation’s Anti-Poverty Strategy. 2016.
- Eyles A, Major LE, Machin S. Social Mobility – Past, Present and Future. 2022.
- Ford T, Parker C, Salim J, Goodman R, Logan S, Henley W. The relationship between exclusion from school and mental health: A secondary analysis of the British Child and Adolescent Mental Health Surveys 2004 and 2007. Psychol Med. 2018;48(4).
- Gill K, Quilter-Pinner H, Swift D. Making The Difference: Breaking the link between school exclusion and social exclusion [Internet]. 2017 [cited 2022 Sep 2]. Available from: https://www.ippr.org/files/2017-10/making-the-difference-report-october-2017.pdf
- Hammond C. Impacts of lifelong learning upon emotional resilience, psychological and mental health: Fieldwork evidence. Vol. 30, Oxford Review of Education. 2004.
- Akinwale B, Allen J, Bartley M, Beale N, Brooks F, Buck D, et al. Local action on health inequalities: Adult learning services Introduction 4 [Internet]. 2014 [cited 2022 Oct 3]. Available from: https://assets.publishing.service.gov.uk/government/uploads/system/uploads/attachment_data/file/356063/Review4_Adult_learning_health_inequalities.pdf
- Betthäuser BA, Bach-Mortensen AM. A systematic review and meta-analysis of the impact of the COVID-19 pandemic on learning. 2021;
- Sharp C, Nelson J, Lucas M, Julius J, Mccrone T, Sims D. The challenges facing schools and pupils in September 2020 [Internet]. 2020. Available from: https://www.nfer.ac.uk/
- Farquharson C, Mcnally S, Tahir I. Education inequalities. 2022.
- Marmot M. Health equity in England: The Marmot review 10 years on. The BMJ. 2020;368.
- Timpson E. Timpson Review of School Exclusions [Internet]. 2019 [cited 2022 Oct 10]. Available from: https://assets.publishing.service.gov.uk/government/uploads/system/uploads/attachment_data/file/807862/Timpson_review.pdf
- Department for Education. Statistics: further education and skills [Internet]. 2022 [cited 2022 Oct 4]. Available from: https://www.gov.uk/government/collections/further-education-and-skills-statistical-first-release-sfr
- Smith R, Egglestone C, Jones E, Aldridge F. Adult Participation in Learning Survey 2019 [Internet]. 2019 [cited 2022 Oct 5]. Available from: https://learningandwork.org.uk/wp-content/uploads/2020/04/Adult-Participation-in-Learning-Survey-2019.pdf
- Department for Education. Permanent exclusions and suspensions in England [Internet]. 2022 [cited 2022 Oct 7]. Available from: https://explore-education-statistics.service.gov.uk/find-statistics/permanent-and-fixed-period-exclusions-in-england
- Department for Education. Statistics: widening participation in higher education [Internet]. 2022 [cited 2022 Oct 4]. Available from: https://www.gov.uk/government/collections/widening-participation-in-higher-education