Socioeconomic deprivation
- Deprivation is about more than lack of money. It can include lack of access to resources such as adequate housing and exposure to negative stressors such as violence, crime or lack of public green space (4).
- Deprivation is deeply intertwined with mental health (5).
Why is deprivation important to mental health?
- Deprivation and mental health are highly connected.
- For example, there is a strong link between deprivation and psychotic disorders, and depression (6,7).
- Socioeconomically disadvantaged children and adolescents are 2 to 3 times more likely to develop mental health conditions than their peers (8).
- There are higher rates of people living with severe mental illness (SMI) in more deprived communities.
- SMI are mental health problems which severely limit people’s ability to engage with work and other activities (9). They are typically long lasting and may involve hospitalisation or psychosis.
- Most commonly, this refers to bipolar disorder, psychosis and personality disorders; but this group can also include severe depression and anxiety.
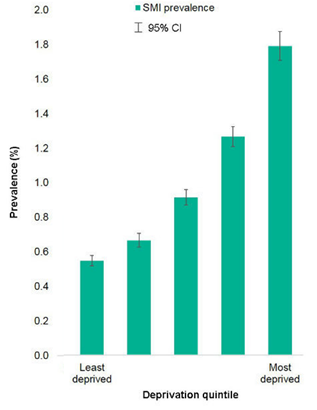
Figure 2: Prevalence of SMI in people aged between 15 and 74 by IMD quintile. Source: (10)
- Although people living in deprived areas have a higher risk of mental ill health than people living in more affluent neighbourhoods, they are less likely to access mental health support, and less likely to recover following treatment (4).
- Childhood deprivation is strongly linked to experiencing deprivation in adulthood (11), highlighting the potential long-term impacts of deprivation.
Life expectancy
- As well as mental health and wellbeing, deprivation is linked to a range of physical health outcomes.
- There is a strong relationship between deprivation and overall life expectancy across England (12); as well as between deprivation and healthy life expectancy (how long people can expect to live in good health) (13).
- People living in more deprived areas are likely to live with multiple health problems from a relatively young age, most commonly a combination of mental and physical health conditions (14).
- Manging multiple health conditions can pose specific challenges to mental health in terms of navigating fragmented healthcare services and managing self-care (15). The links between mental and physical health are explored further in Chapter 2.
What is the national picture?
Different types of deprivation are highly correlated, so people experiencing one type of deprivation are likely to experience a range of other deprivation types. For example, areas with high income deprivation are likely to have poor housing and environmental conditions, and high rates of crime (16).
What is the local picture?
- Pockets of deprivation are found across all districts of Cambridgeshire and Peterborough.
- Using Indices of Multiple Deprivation (IMD), Fenland and Peterborough are more deprived than the national average. This is a multidimensional score based on 7 domains, covering crime, housing, education, income, employment, living environment, and health (16).
- This is in contrast with other areas of Cambridgeshire, in which deprivation levels are below the English average.
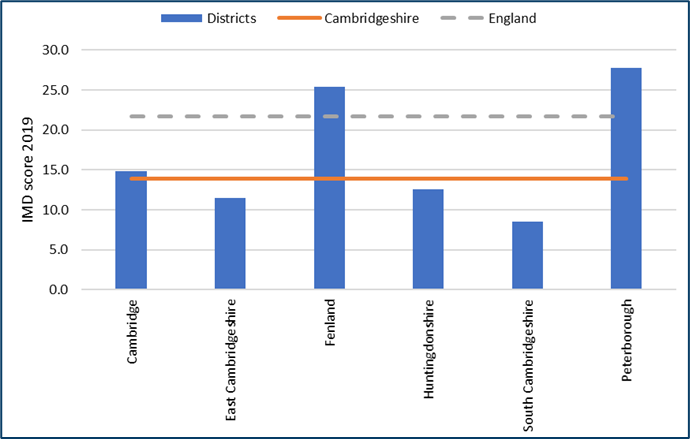
Figure 3: IMD scores across C & P. Data source: (16)
- When broken down at Lower Layer Super Output Areas level. it becomes clear that there are other smaller pockets of deprivation within the C&P.
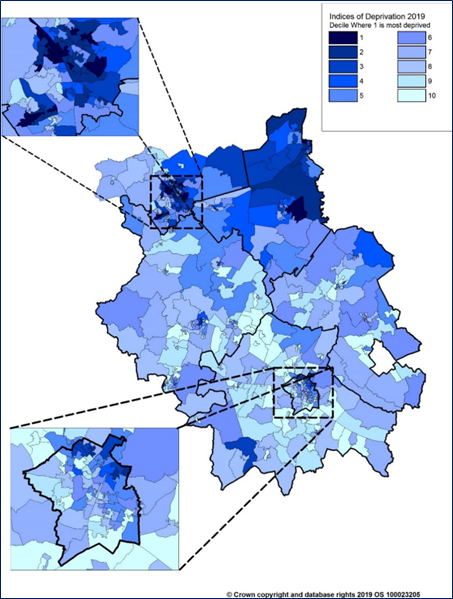
Figure 4: IMD across Cambridgeshire and Peterborough. Source: Cambridgeshire County Council 2019
- As IMD is an area measure, there is still individual variation within these areas.
- Around a fifth of children (aged 0-15) in Peterborough (20.8%) and Fenland (20.1%) live in income deprived households, which is significantly higher than the national average (17.1%) (16).
- The rate of income deprivation affecting older people is high in Peterborough and Fenland, with fewer deprived areas seen in other parts of Cambridgeshire (King & Leeman, 2019).
Life Expectancy
- Overall life expectancy in Peterborough is significantly lower than the national average (17).
- Under 75 mortality rates from preventable causes are consistently above than the national average in Peterborough and Fenland (17).
- An above average rate of preventable deaths from cancer is a key driver of the difference in under 75 mortality rates between Cambridgeshire and Peterborough (17).
![Under 75 mortality rate per 100,000 from causes considered preventable in C&P, compared to the national average, in 2020. Source: Office for Health Improvement and Disparities. Public Health Outcomes Framework. Fingertips. 2022 [cited 2022 Oct 4]. Available from: https://fingertips.phe.org.uk/profile/public-health-outcomes-framework](https://cambridgeshireinsight.org.uk/wp-content/uploads/2022/12/CInsights-pic5-1024x496.png)
Figure 5: Under 75 mortality rate per 100,000 from causes considered preventable in C&P, compared to the national average, in 2020. Data source: (17)
- Women in Cambridgeshire can expect to enjoy 9 additional years of good health compared to women in Peterborough (17).
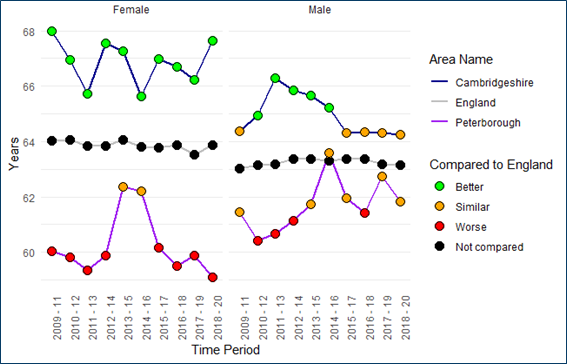
Figure 6: Healthy life expectancy at birth in C & P from 2001 to 2020. Data source: (17)
Additional resources
- The local data pack gives an overview of key data and trends
- NIHR summary of why deprivation is important to public mental health
- The Health Foundation evidence hub on health inequalities
- Further local data on deprivation
References
Full list of references can be found here
4. Public Health England. Mental health: environmental factors [Internet]. Mental health and wellbeing: JSNA toolkit. 2019 [cited 2022 Sep 5]. Available from: https://www.gov.uk/government/publications/better-mental-health-jsna-toolkit/2-understanding-place
- Marmot M, Bell R. Fair society, healthy lives. Public Health. 2012;126(SUPPL.1).
- Firth J, Siddiqi N, Koyanagi A, Siskind D, Rosenbaum S, Galletly C, et al. The Lancet Psychiatry Commission: a blueprint for protecting physical health in people with mental illness. Vol. 6, The Lancet Psychiatry. 2019.
- Remes O, Lafortune L, Wainwright N, Surtees P, Khaw KT, Brayne C. Association between area deprivation and major depressive disorder in British men and women: A cohort study. BMJ Open. 2019;9(11).
- Reiss F. Socioeconomic inequalities and mental health problems in children and adolescents: A systematic review. Vol. 90, Social Science and Medicine. 2013.
- National Mental Health Intelligence Network. Severe mental illness (SMI) and physical health inequalities: briefing – GOV.UK. Public Health England. 2018;
- Public Health England. Severe mental illness (SMI) and physical health inequalities: briefing [Internet]. 2018 [cited 2022 Nov 3]. Available from: https://www.gov.uk/government/publications/severe-mental-illness-smi-physical-health-inequalities/severe-mental-illness-and-physical-health-inequalities-briefing#fnref:7
- Colman I, Jones PB, Kuh D, Weeks M, Naicker K, Richards M, et al. Early development, stress and depression across the life course: Pathways to depression in a national British birth cohort. Psychol Med. 2014;44(13).
- Office for National Statistics. Health state life expectancies by national deprivation deciles, England: 2018 to 2020 [Internet]. Data and analysis from Census 2021. 2022 [cited 2022 Sep 2]. Available from: https://www.ons.gov.uk/peoplepopulationandcommunity/healthandsocialcare/healthinequalities/bulletins/healthstatelifeexpectanciesbyindexofmultipledeprivationimd/latest
- The Health Foundation. Life expectancy and healthy life expectancy at birth by deprivation [Internet]. 2022 [cited 2022 Sep 2]. Available from: https://www.health.org.uk/evidence-hub/health-inequalities/life-expectancy-and-healthy-life-expectancy-at-birth-by-deprivation
- McLean G, Gunn J, Wyke S, Guthrie B, Watt GCM, Blane DN, et al. The influence of socioeconomic deprivation on multimorbidity at different ages: A cross-sectional study. British Journal of General Practice. 2014;64(624).
- Naylor C, Parsonage M, Mcdaid D, Knapp M, Fossey M, Galea A. Long-term condition and mental health [Internet]. The King’s Fund. 2012 [cited 2022 Sep 7]. Available from: https://www.kingsfund.org.uk/sites/default/files/field/field_publication_file/long-term-conditions-mental-health-cost-comorbidities-naylor-feb12.pdf
- MHCLG. Indices of Deprivation. Ministry of Housing, Communities and Local Government; 2019.
- Office for Health Improvement and Disparities. Public Health Outcomes Framework [Internet]. Fingertips. 2022 [cited 2022 Oct 4]. Available from: https://fingertips.phe.org.uk/profile/public-health-outcomes-framework