Demographics
The age and gender structure of the local population is an important driver of health need and demand for health services.
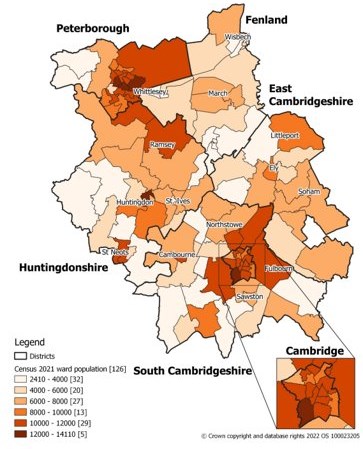
Figure 1: Population by ward across C & P in 2021. Data source: Cambridgeshire Insight
Comparing the Census in 2011 and in 2021, Cambridge (17.6%) and Peterborough (17.5%) had the highest percentage increase in their populations. East Cambridgeshire (4.7%) showed the smallest increase. The percentage change in population size was higher than the national average in all areas across C & P, except East Cambridgeshire (which was lower) and Huntingdonshire (which was similar).
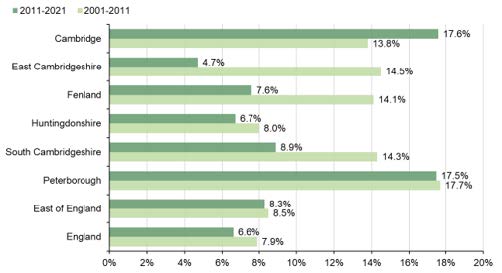
Figure 2: % change in usual resident population across C & P, Census 2001 to 2021. Data source: Cambridgeshire Insight
The latest census results show that the population of people aged 65 years or older had the highest increase of each group for all areas of C & P, other than Cambridge. There have also been large increases in the population size of under 65s in Peterborough and Cambridge over the last 10 years. Some areas had greater rates of population increase than others.
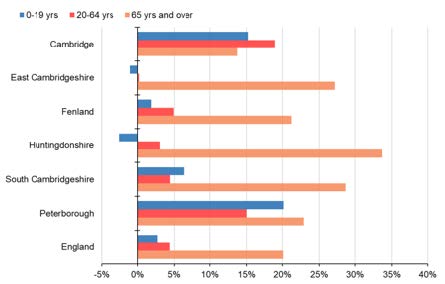
Figure 3: % change in population by age group across C & P, Census 2011 to 2021. Data source: Cambridgeshire Insight
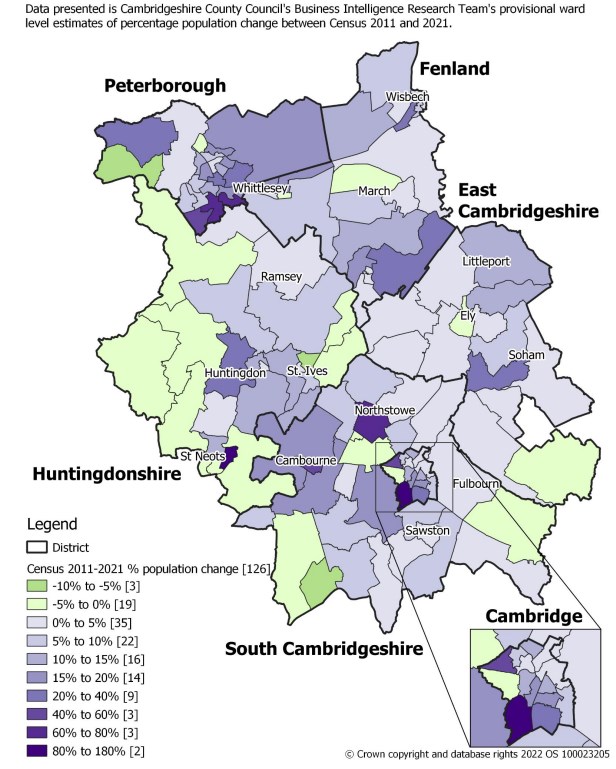
Figure 4: C & P percentage population change 2011 to 2021, by ward. Data source: Cambridgeshire Insight
Additional resources
- The local data pack gives an overview of key data and trends
- Cambridgeshire Insight data on population demographics, including the 2023 JSNA