JSNA 2023 home page Dashboard user guide Contents page
This JSNA section contains a range of data that describes the health of our population in Cambridgeshire and Peterborough. Previously we have looked at death rates (mortality), and while mortality rates are relatively easy to measure, many health conditions can cause pain and disability without (or before) leading to death. These conditions affect our population’s wellbeing as well as causing significant costs for our health and care services.
This section does contain some information on mental health (serious mental illness and depression are included in the ‘Prevalence of disease in adults’ section below, but for a more in-depth analysis of data on mental health in Cambridgeshire and Peterborough, please see our ongoing Mental Health Needs Assessment.
Self-reported health
In March 2021, as part of the Census, residents were asked how they felt their general health was, allowing us to gauge the self-reported health of our population at a moment in time. As health is closely related to age, and generally health declines as people get older, the Census produced age-standardised rates that take into account differences in the size and age of populations and allows comparison across and between areas. Subjective self-rated health is a good predictor of mortality and is also used in the calculation of healthy life expectancy (see elsewhere in this JSNA). Page 2 of the dashboard below displays results.
At the time of the Census 6.0% of Peterborough residents and 4.2% of Cambridgeshire residents reported that their health was ‘bad’ or ‘very bad’, compared to 5.3% nationally. Fenland also had a higher percentage at 6.0%. When compared to their statistical neighbours (page 3) Peterborough and Fenland were within the mid-range of local authorities for people who self-reported poor health.
The map in the dashboard (accessed by a button on page 2) allows users to see how good or poor health varies across smaller areas (please note that the data shown on the map has not been age-adjusted). Self-reported poor health is highest in the more deprived areas, with wards within Wisbech, March and the more urban areas of Peterborough having the highest proportions of people in poor health.
Page 4 of the dashboard shows how answers to the question on health changed between the 2011 Census and 2021. There have not been substantial changes in the proportion of people reporting bad or very bad health; in some of our areas it has decreased slightly (Cambridge) and in other areas it increased slightly (East Cambridgeshire, Fenland, Huntingdonshire and South Cambridgeshire) but changes were small.
Disability
Another section of the JSNA has data on disability.
Prevalence of disease and health conditions in adults
‘Prevalence’ refers to the proportion of the population who experience a condition at any one time. This section reports on conditions that are recorded in GP records where prevalence data is made public as part of the Quality and Outcomes Framework, or QOF. The QOF framework does not cover all conditions and some caution should be used with the data as it does depend on the quality of recording diagnosis codes for conditions. For example, obesity is included as a QOF indicator but we know that obesity is under-recorded in this dataset (we do not present the obesity data here). When comparing areas, users should also be aware that prevalence rates from QOF data are not age-adjusted, so for example an area with a younger population (such as Cambridge) may have much lower rates of conditions that are less common in younger people.
This section does contain some information on mental health (serious mental illness and depression are included in the ‘Prevalence of disease in adults’ section below, but for a more in-depth analysis of data on mental health in Cambridgeshire and Peterborough, please see our ongoing Mental Health Needs Assessment.
Open this dashboard as a new pageThe dashboard (page 2) shows that over one in eight (12.9%) people across Cambridgeshire and Peterborough are known to have hypertension. While this is a very large number of people (nearly 130,000), the rate is lower than the England average of 14.4%.
A similar proportion are known to have depression (11.5%; England average is higher at 13.2%), and the next most frequently recorded conditions for Cambridgeshire and Peterborough are diabetes and asthma (6.5% and 6.4%).
The figures for Cambridgeshire and Peterborough as a whole however hide considerable local variation. For hypertension, Fenland has a recorded prevalence rate of 17.3%, which is much higher than the Cambridgeshire and Peterborough overall figure, and the rate in Cambridge is just 7.6%. These rates are not age-adjusted and the difference is likely due to the younger population in Cambridge.
Fenland also has the highest rate for depression prevalence (14.3%) and Cambridge the lowest (8.6%). However, prevalence of depression is the highest recorded condition prevalence in Cambridge, which is a different pattern to all other districts, regionally and nationally where hypertension is the highest recorded prevalence.
Child health
Open this dashboard as a new page
Good data on disease prevalence in children is rarer than data on prevalence in adults and there is no information on self-rated health collected nationally. However, data on emergency admissions of children and young people with some long term conditions is likely to reflect both prevalence and the children’s access to out-of-hospital care, and benchmarking against geographical and statistical neighbours will support service review and redesign.
This data is presented on page 2 of the dashboard. Data on children and young people’s hospital admissions (under 19 years) for asthma, diabetes, epilepsy and mental health conditions shows that Cambridgeshire and Peterborough have rates that are either ‘similar to’ or ‘better than’ the England average.
Admissions for asthma (under 19 years) are statistically significantly lower in Cambridgeshire (70.7 per 100,000) than in Peterborough (142.5 per 100,000) (England rate is 131.5 per 100,000).
Compared to its nearest neighbours (use button on page 2 of the dashboard), Cambridgeshire is the local authority with the second lowest rates of hospital admissions for mental health conditions (59.8/100,000). Cambridgeshire also has relatively low rates of hospital admissions for asthma (70.7/100,000). Compared to its nearest neighbours, Peterborough is the local authority with the second lowest rates of hospital admissions for epilepsy (44.5/100,000). For other categories of asthma, diabetes, epilepsy and mental health conditions shown on the visualisation Cambridgeshire and Peterborough are fairly comparable to their nearest neighbours overall.
Multi-morbidity
Multi-morbidity is the term for having more than one health condition, and the risk of multi-morbidity is very strongly linked to age, as can be seen in the chart below. Multimorbidity and chronic health conditions are strongly linked to self-rated health. Across Cambridgeshire and Peterborough as a whole (the NHS ICB area which is slightly larger than the local authority area), in 2021 73.2% of all residents had no long term conditions, 13.2% had one condition, 13.6% had at least two conditions. In the older age band of 65 to 84 year olds, only 34.5% had no recorded conditions, and 44.8% had at least two conditions. Among the oldest people aged 85 and over, the proportion who had at least two recorded conditions increases to a substantial 73.4%.
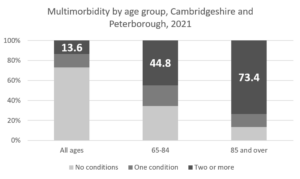
This data is estimated prevalence data based on secondary care use, from NHS England’s Population and Person Insight dashboard.