Service provision
- Nationally, there has been a significant rise in demand for mental health services for children and young people, which has not been matched by increases in service provision (House of Commons Committee, 2021).
- Cambridgeshire and Peterborough’s children and young people’s mental health strategy 2022 – 2025 (2022-2025) explored the number of children and young people accessing local mental health services.
National picture
There has been a significant rise in demand for mental health services for children and young people, which has not been matched by increases in service provision (House of Commons Committee, 2021).
- Pre-pandemic, around 60% of children and young people who had a mental health condition were not accessing mental health support (Health and Social Care Committee, 2021).
- There are substantial delays between when people first display the symptoms of poor mental health and starting treatment: this ranges from 6-8 years in mood disorders, 6 years in bipolar disorder and between 9 to 23 years for anxiety disorders (Fusar-Poli, 2019).
- High access thresholds and long waiting times for services mean that many young people’s mental health problems escalate to the point of crisis (Care Quality Commission, 2018a).
- In 2021-22, the average time spent waiting after being referred to specialist mental health services and receiving treatment in England increased to 40 days, from 32 days in 2020-21 (Children’s Commissioner, 2023a).
- Around 1 in 4 children who were referred to services in 2020/21 did not get accepted at all (their referrals were closed before treatment) (Children’s Commissioner, 2023b).
- There are ‘unsustainable’ staff shortfalls in many mental health services (Health and Social Care Committee, 2021), and staff shortages are a major barrier to improving and expanding mental health services. During 2021-22, 17,000 staff (12%) left the NHS mental health workforce, up from 13,000 (9%) a year earlier (Department of Health & Social Care, 2023).
- There are too many children and young people in inpatient units subject to inappropriate care; including care that is far from home and involves restrictive interventions, the experiences of which are often traumatic (Health and Social Care Committee, 2021).
Children’s Commissioner’s review of mental health services
Children’s Commissioner’s review of mental health services in the England describes a ‘crisis in children’s mental health’. This report highlights that early support and intervention would mean that fewer children would need to access mental health services. Instead, children are ‘waiting far too long’ to access support, often reaching a point of crisis. It highlights the need for ‘long-term’ thinking about children’s mental health, which focuses on prevention and upstream factors such as poverty, as well as early access to support.
What are the national trends in children’s mental health services?
- National data shows a large increase in the proportion of children with mental health conditions, particularly in young women and children and care.
- Most children entering treatment in mental health services were aged 10+, particularly those aged between 13 and 15
- The most common known reasons for referrals to children and young people’s mental health services (CYMPS) were anxiety, being ‘in crisis’ and neurodevelopmental conditions (excluding autism)
How does Cambridgeshire and Peterborough compare to other areas?
In Cambridgeshire and Peterborough, the mean wait time for CYPMHs was 124 days in 2022/23. This means that children and young people waited over 4 months on average to receive 2 contacts from CYPMHs.
In this report, Cambridgeshire and Peterborough was given a combined score of 8 out of 20, based on spending on children and young people’s mental health services, wait times, and referrals closed before treatment. This places Cambridgeshire and Peterborough as the joint 5th lowest scoring ICB in England. Cambridgeshire and Peterborough ICB had the joint second highest proportion of closed treatment for referrals in CYPMHs in England, with half of referrals closing before treatment in 2022/23. Cambridgeshire and Peterborough also had the fifth lowest spend per child with an active referral.
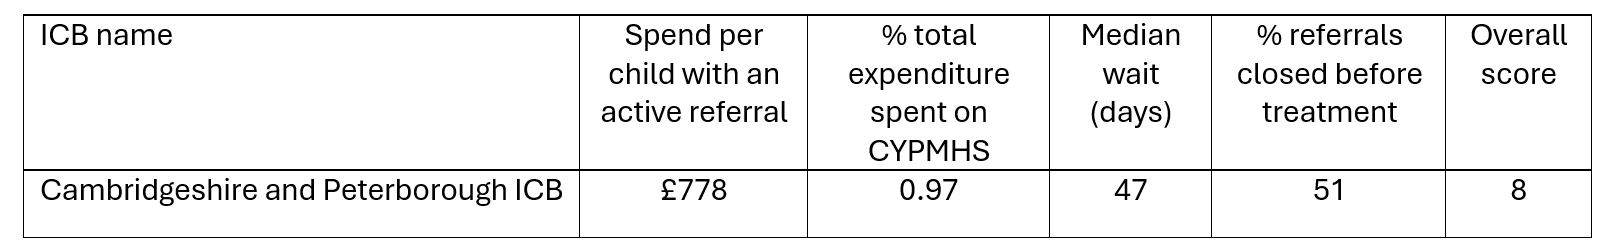
Note: ‘For each indicator, ICBs were ranked from best to worst (e.g. shortest waiting time to longest) and assigned to 5 groups. Scores were then given to each ICB based on their group. The best performing 20% of ICBs received a score of 5 while the worst performers received a score of 1. CCo then added these scores together into an overall score ranging from a minimum of 4 (worst) to a maximum of 20 (best) for each ICB. An overall score of 4 would mean being in the bottom group across all 4 measures while a score of 20 would mean being in the top (best) group across all measures.’ – Taken from Children’s mental health services 2022-23
This report highlights the limitations of this data: for example, ‘contacts’ with mental health services are not the same as a meaningful assessment or support. It is also unclear how to interpret referrals which are closed before treatment – whether this means children are unable to access support, or that a child was signposted to another service that better meets their needs.
Local picture
Local service provision can be understood through the THRIVE framework, which was introduced in Cambridgeshire and Peterborough in 2015, to replace the tiered model of mental health services (i-THRIVE, 2023). This person-centred and needs-led approach was developed by the Anna Freud National Centre for Children and Families and the Tavistock and Portman NHS Foundation Trust.
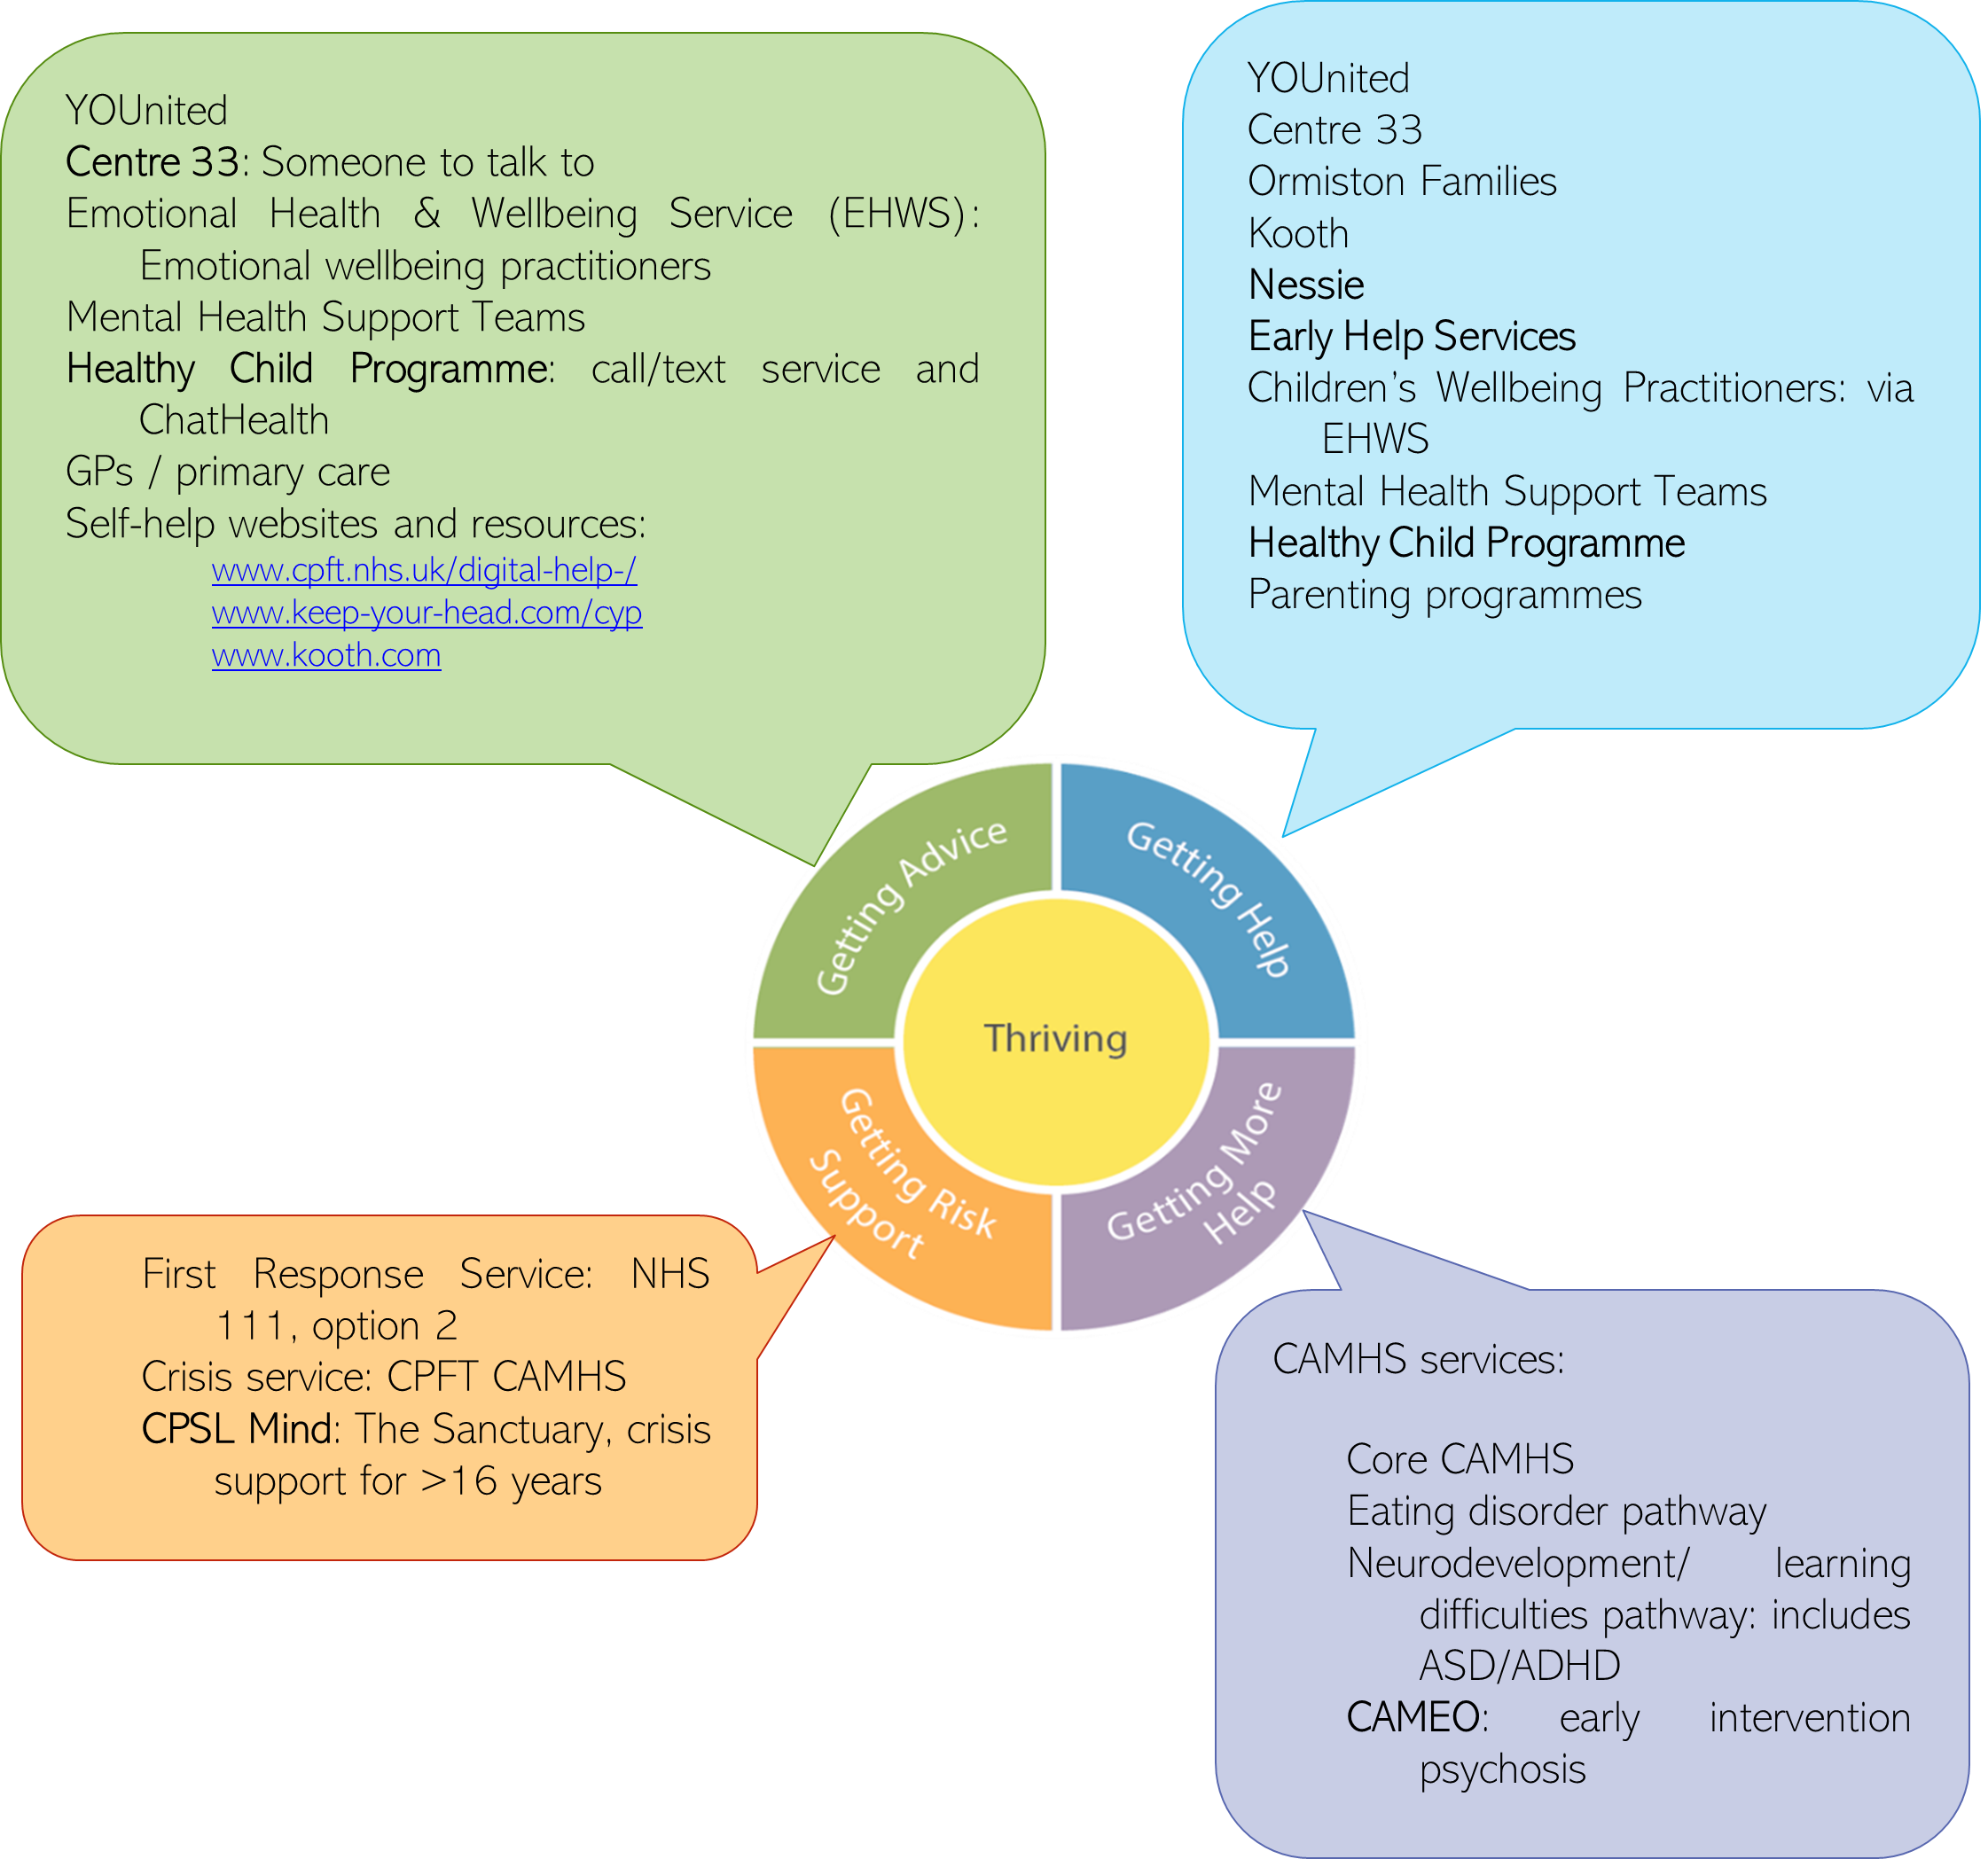
Figure 33: Services available for children and young people in Cambridgeshire and Peterborough. Image source: Mapping spend across children and young people’s mental health services Cambridgeshire and Peterborough
The Mental Health and Wellbeing Pre-birth to Age 25 years Needs Assessment (2019) included a mapping of services in Cambridgeshire and Peterborough supporting children and young people’s mental health. The Cambridgeshire and Peterborough’s children and young people’s mental health strategy 2022 – 2025 (2022-2025) built on this analysing service data from:
- Health services: YOUnited, Child and Adolescent Mental Health Services, the First Response Service, Emotional Health and Wellbeing Service, Adult Mental Health Services and adult inpatient data.
- Local authority services: Early Help.
- Voluntary and Community sector services: Blue Smile, Centre 33, Choices Counselling, CPSL Mind, Kooth.com, Ormiston Families, Romsey Mill, Talk to Stars, Turtle Dove Cambridge, YMCA Trinity Group and Young People’s Counselling Service.
- Alongside statutory services, a vibrant network of voluntary and community organisations across Cambridgeshire and Peterborough is delivering innovative, youth-led and arts-based approaches that are transforming mental health support for children and young people. Explore good practice examples.
Additional resources
- Briefing: Improving children and young people’s mental health services
- Children and young people’s mental health
- Children’s mental health services 2022-23
- Further detail on the THRIVE model of mental health services
- Anna Freud Centre for Children and Families tool Understanding treatment options
- East of England Mental Health Crisis Care Toolkit – Children and Young People
References
Full list of references is included at the end of this chapter.