Local Population and Dwelling Stock Estimates and Forecasts
On this page are Cambridgeshire County Council’s locally produced population and dwelling stock estimates and forecasts for the districts of Cambridgeshire: Cambridge City, East Cambridgeshire, Fenland, Huntingdonshire and South Cambridgeshire, as well as for Peterborough Unitary Authority.
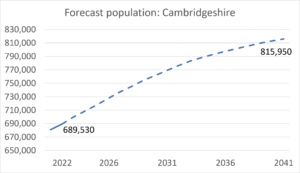
The mid-2022 population and dwelling stock estimates and 2022-based population and dwelling stock forecasts are the latest available. They indicate that population is forecast to grow by an average of just under 1% per year between 2022 and 2041.
- Cambridgeshire’s population is forecast to grow by 18% between 2022 and 2041, to reach a population of almost 816 thousand by 2041.
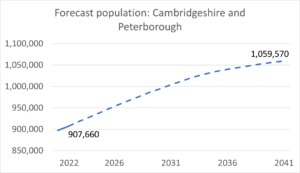
- Cambridgeshire and Peterborough’s population is forecast to grow by 17% between 2022 and 2041, to reach a population of almost 1.06 million by 2041.
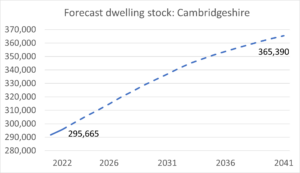
Almost 70 thousand new dwellings are forecast to be completed between 2022 and 2041 in Cambridgeshire, a rise in total dwelling stock of 24%.
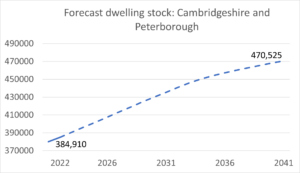
In Cambridgeshire and Peterborough almost 85 thousand new dwellings are forecast to be completed between 2022 and 2041, a rise in total dwelling stock of 22%.
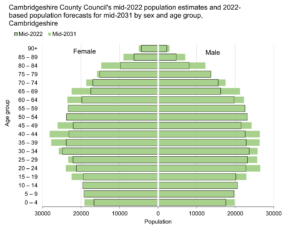
Cambridgeshire and Peterborough: mid-2022 to mid-2031 population pyramids

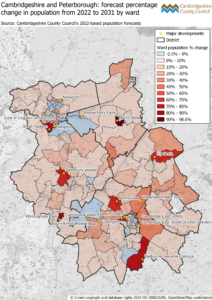
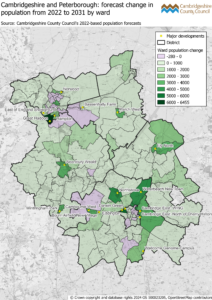
Cambridgeshire and Peterborough: ward maps of population change 2022 to 2031
Cambridgeshire County Council’s (CCC) population forecasts are ‘policy-led’, so that they are consistent with planned levels of house-building. The 2022-based population and dwelling stock forecasts are mainly based on the local authorities’ published 2022 and 2023 housing trajectories. The published trajectories detail the number and phasing of dwellings expected to come forward on individual sites.
The authority and ward-level dwelling stock forecasts can present an optimistic view of dwelling stock growth as they assume that all planned dwellings are built according to policy. The extent to which policy targets are achieved depends on many factors, including market forces and the economy.
Many of the wards that are forecast to have the highest percentage growth in population between 2022 and 2031 are those that contain significant housing developments. The maps below show the forecast percentage change and forecast change numerically in ward populations between 2022 and 2031 from CCC’s 2022-based population forecasts, along with the location of significant housing developments in Cambridgeshire and Peterborough provided for context. Below the maps is commentary on some of the main changes forecasts in each of the local authority areas.
Cambridge
Two wards in Cambridge are forecast to have population growth greater than 10% between 2022 and 2031. The ward forecast to have the highest population growth is Castle (61.7%), which contains the two major developments of Eddington and Darwin Green. Cherry Hinton ward, which contains part of the Cambridge East: Land North of Cherry Hinton development, has the second highest population growth (18.9%).
East Cambridgeshire
The ward in East Cambridgeshire forecast to have the highest population growth is Ely North (63.8%), which contains a major housing development also called Ely North. Wards with smaller housing developments also have noticeable population growth forecasts, such as Fordham & Isleham (26.8%), Soham South (25.8%) and Littleport (20.9%).
Fenland
The ward in Fenland forecast to have the highest population growth is March South (98.6%), which contains the Local Plan strategic allocations of South East March, South West March and West March, which between them account for more than 3,000 new homes. Other wards with notable population growth forecasts are Chatteris South (30.0%), which contains a major development with outline planning permission, and Leverington & Wisbech Rural (26.0%), which contains the West Wisbech Broad Location for Growth.
Huntingdonshire
The two wards in Huntingdonshire forecast to have the highest population growth are St Neots East (81.7%), which contains the Wintringham Park housing development, and The Stukeleys (61.2%), which contains the Alconbury Weald housing development.
South Cambridgeshire
South Cambridgeshire has a variety of wards which are forecast to have high population growth between 2022 and 2031. Most notable are wards that contain significant new settlements, such as Longstanton (62.3%) which contains the Northstowe new town development, Milton & Waterbeach (37.8%) which contains the Waterbeach new town development and Caldecote (27.0%) which includes the Bourn Airfield new village development. Wards on the periphery of Cambridge are also anticipated to have high population growth, such as Girton (29.5%) which includes parts of the Eddington development, and Fen Ditton and Fulbourn (33.5%) which includes the two Cambridge East developments of WING and North of Cherry Hinton. There is also significant population growth forecast for Duxford ward (72.6%), which contains the Wellcome Genome Campus development.
Peterborough
The ward in Peterborough forecast to have the highest population growth is Hampton Vale (75.3%), which contains the major housing development of Great Haddon. Other wards forecast to have high levels of population growth are Hargate and Hempsted (28.0%), which contains the Hampton development, and Gunthorpe (26.6%) which contains the Norwood development.
Cambridgeshire and Peterborough: mid-2022 population and dwelling stock estimates and 2022-based population and dwelling stock forecasts
Cambridgeshire County Council’s population and dwelling stock estimates for mid-2022 build from Census 2021 data and the mid-2021 estimates. They are produced using local data sources, and forecast ahead to 2041.
Cambridgeshire County Council’s population forecasts are ‘policy-led’, so that they are consistent with planned levels of house-building. The 2022-based population and dwelling stock forecasts are mainly based on the local authorities’ published 2022 and 2023 housing trajectories, with some interpolation and extrapolation by Cambridgeshire County Council.
Cambridgeshire and Peterborough mid-2022 estimates (xlsx, 116KB)
2022-based population forecasts (xlsx, 164KB)
2022-based dwelling stock forecasts (xlsx, 55KB)
Cambridgeshire and Peterborough estimates and forecasts: previously published datasets
Earlier publications of Cambridgeshire County Council’s population and dwelling stock estimates and population and dwelling stock forecasts are available under the population section of the document library.
Historic Population
Importance of historic population records
The Census in the UK has been conducted every 10 years since 1801. Over this time there have been numerous changes to the administrative boundaries, such as the amalgamation and deletion of wards and parishes, or the creation of new ones. These occur for a range of reasons, but usually to better distribute the population for administrative purposes.
Without knowledge about boundary changes it can be difficult to understand changes observed in populations, or make comparisons of areas over time. For example, moving a parish boundary may cause a population to increase on paper, within a given parish, but only because part of the population of a neighbouring parish has been incorporated, and not because a sudden influx of new residents.
The full dataset can be found on our Open Data Portal.
Local records
Cambridgeshire County Council have tried to keep a record of the changes to parishes over time, and the estimated populations as published by each Census, since 1801. This way we are better able to explain apparent changes to the populations estimated by each Census. You will find the most up to date versions of these records on our Open Data Portal.
Interactive Report
Use the drop down menus above to select between different wards and districts.