Loneliness is a universal public health issue that significantly impacts health and wellbeing and generates more demand for social care and health services.
What is loneliness?
In using this term, Cambridgeshire County Council (CCC) are referencing the following definition of loneliness: ‘a subjective feeling about the gap between a person’s desired levels of social contact and their actual level of social contact. It refers to the perceived quality of the person’s relationships.’
In using this term, CCC are referencing the following definition of loneliness: ‘a subjective feeling about the gap between a person’s desired levels of social contact and their actual level of social contact. It refers to the perceived quality of the person’s relationships.’
Loneliness is often viewed as interchangeable with social isolation, however although isolation can be a factor that contributes to loneliness, the two conditions can arise independently from one another. Loneliness is never desired and lessening these feelings can take a long time.
Social isolation is ‘an objective measure of the number of contacts that people have. It is about the quantity and not quality of relationships’. British Red Cross found from their research that of the individuals who often feel lonely, two thirds frequently feel completely alone even when surrounded by other people.
In most cases, people can choose and control the number of contacts that they have. Therefore an individual experiencing loneliness may not be socially isolation and isolated individual will not necessarily suffer from loneliness.
Individuals that are lonely are:
- 8 times more likely to visit the GP,
- 6 times more likely to visit A&E,
- 3 times more likely to have an emergency hospital admission, and
- 5 times more likely to enter local authority-funded residential care
- 9 times more likely to develop dementia in the following 15 years, and
- Two-thirds more likely to be physically inactive, which may lead to a 7% increased likelihood of diabetes, 8% increased likelihood of stroke and 14% increased likelihood of CHD
Most Lonely Groups (Office of National Statistics (ONS) Community Life Survey 2018)
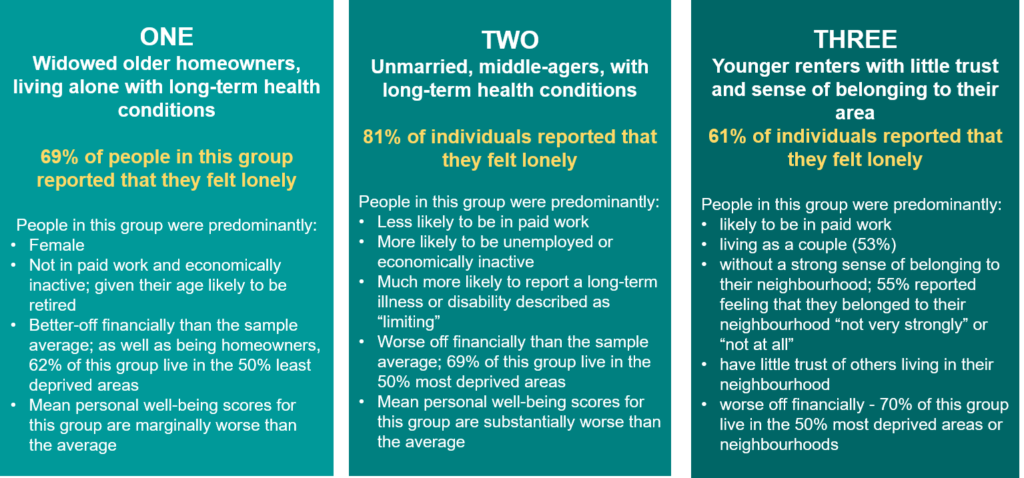
Widowed older homeowners, living alone with long-term health conditions:
69% of people in this group reported that they felt lonely
People in this group were predominantly:
- Female
- Not in paid work and economically inactive; given their age likely to be retired
- Better-off financially than the sample average; as well as being homeowners, 62% of this group live in the 50% least deprived areas
- Mean personal well-being scores for this group are marginally worse than the average
Unmarried, middle-agers, with long-term health conditions:
81% of individuals reported that they felt lonely
People in this group were predominantly:
- Less likely to be in paid work
- More likely to be unemployed or economically inactive
- Much more likely to report a long-term illness or disability described as “limiting”
- Worse off financially than the sample average; 69% of this group live in the 50% most deprived areas
- Mean personal well-being scores for this group are substantially worse than the average
Younger renters with little trust and sense of belonging to their area
61% of individuals reported that they felt lonely
People in this group were predominantly:
- likely to be in paid work
- living as a couple (53%)
- without a strong sense of belonging to their neighbourhood; 55% reported feeling that they belonged to their neighbourhood “not very strongly” or “not at all”
- have little trust of others living in their neighbourhood
- worse off financially – 70% of this group live in the 50% most deprived areas or neighbourhoods
Adults with Learning Difficulties
- People with a learning disability tend to have fewer friends and fewer opportunities for socialising than the general population.
- Over half of adults with a learning disability feel lonely sometimes or often
- 85% of young disabled adults from the 18-34 year old age group feel lonely
- Almost 1 in 3 young people with a learning disability spend less than 1 hour outside their home on a typical Saturday (Mencap, 2016).
- 1,685 Adults (18 and older) with learning disability getting long term support from Local Authorities in Cambridgeshire (2015-16)
- 2,908 patients with learning disabilities, as recorded on practice disease registers (2017-18)
Adults with Sensory Impairments
- 21,200 people living with sight loss in Cambridgeshire
- 3,035 registered blind or partially sighted in Cambridgeshire
English as a second language
British Red Cross research has shown the following:
- people who feel like they ‘belong’ to their community – who feel valued, included, safe and able to join in community activities – are less likely to feel lonely
- Sixty-seven per cent of respondents who felt they didn’t belong in their community said they were ‘always of often’ lonely compared to just 16 per cent who felt they did belong.
- People from Black, Asian and other ethnic backgrounds face multiple challenges that may mean they may be more likely to experience loneliness.
Carers
- Those who have caring responsibilities were found to be 37% more likely to report loneliness than those who do not.
- Research by Carers UK (2015) found that 57% have lost touch with family and friends as a result of their caring role,
- Those who see friends and family less than once a month or never were 84% more likely to be lonely than those who meet up with friends and family daily.
Physical disability and mobility issues
- Research by Sense has shown that up to 50% of disabled people will be lonely on any given day.
- A 2017 study shows that 67% of disabled people have felt lonely in the past year.
- Lund and others (2010) argue that lonely individuals are also at higher risk of the onset of disability.
Data Tools
This Loneliness portal contains three core tools to provide supporting evidence in a variety of formats including an interactive report, interactive map and a data correlation dashboard. These three tools have been created to help visualize key factors that can potentially indicate a higher risk of loneliness prevalence in a given area. These three tools display a variety of indicators at a local level at a variety of geographies.
References
For more detail on which factors are most likely to predict a higher risk of loneliness and how they can be weighted please read the following documents.
ONS Loneliness Profiles – These profiles have been drawn up by the ONS to highlight who is most at risk of Loneliness and the factors involved across society.
Age UK: Loneliness in Later Life – Evidence Review – Age UK have mapped and scored the risk of Loneliness in the over 65 population across the UK. This document contains the methodology for this piece of work.