Recorded prevalence
It can be interesting to compare estimated levels of mental health need (i.e. how many people we expect to experience different mental health conditions) to the number of people presenting to services. This may help to identify unmet needs within our population.
Depression
- In 2022/23, 95,137 adults aged 18+ (5% of those registered at general practices) in Cambridgeshire and Peterborough were recorded as having depression.
- Recorded depression prevalence has been significantly higher than the national average in Fenland since 2016/17.
Prevalence
- 95,137 (5%) of adults registered at general practices in Cambridgeshire and Peterborough were recorded as having depression (aged 18+) in 2022/23, compared to the national average of 13.3%.
- Depression prevalence has increased across all districts since 2016/17, following the national trend.
- Recorded depression prevalence is significantly higher than the national average in Fenland since 2016/17; but is currently below the national average in Cambridge, Huntingdonshire, Peterborough and South Cambridgeshire.
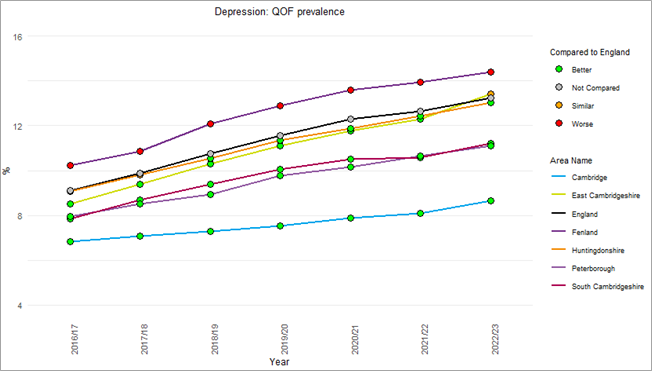
Figure 5: Depression prevalence in adults as recorded by primary care, Cambridgeshire and Peterborough, 2016/17 – 2022/23. Data source: NHS Digital
Treatment-resistant depression
- The i-VALiD study (Informing VALues-based practice in persistent Depression), based in Cambridgeshire and Peterborough, is collecting evidence to improve mental health services for treatment-resistant depression (ARC East of England, 2023).
- People with treatment-resistant depression (depression which has not responded to two or more antidepressants at an adequate dose and duration) should be referred to a specialist service delivered by a specialist multi-professional team (Cummergen et al., 2022).
- This project has taken a values-based approach, drawing together evidence, the priorities of patients and carers, and clinical expertise (ARC East of England, 2023).
- It has resulted to two publications so far: a literature review exploring what outcomes matter to people reviewing treatment for treatment-resistant depression (Cummergen et al., 2022); the other reviewing the strength of economic evidence for different therapies (Hannah et al., 2023). Another piece of work will use focus groups to investigate what patients and clinicians would like to see change about the treatment pathway (ARC East of England, 2023).
How does depression prevalence vary across general practices?
- There is substantial variation in the recorded prevalence of depression across different general practices, across Cambridgeshire and Peterborough, ranging from 4.8% to 35.3%. Some of this variation may be due to differences in how practices record depression.
- The highest recorded prevalence was in the Cambridge Access Surgery (35.3%), which provides specialist GP services to people experiencing homelessness, at risk of homelessness or living in supported housing.
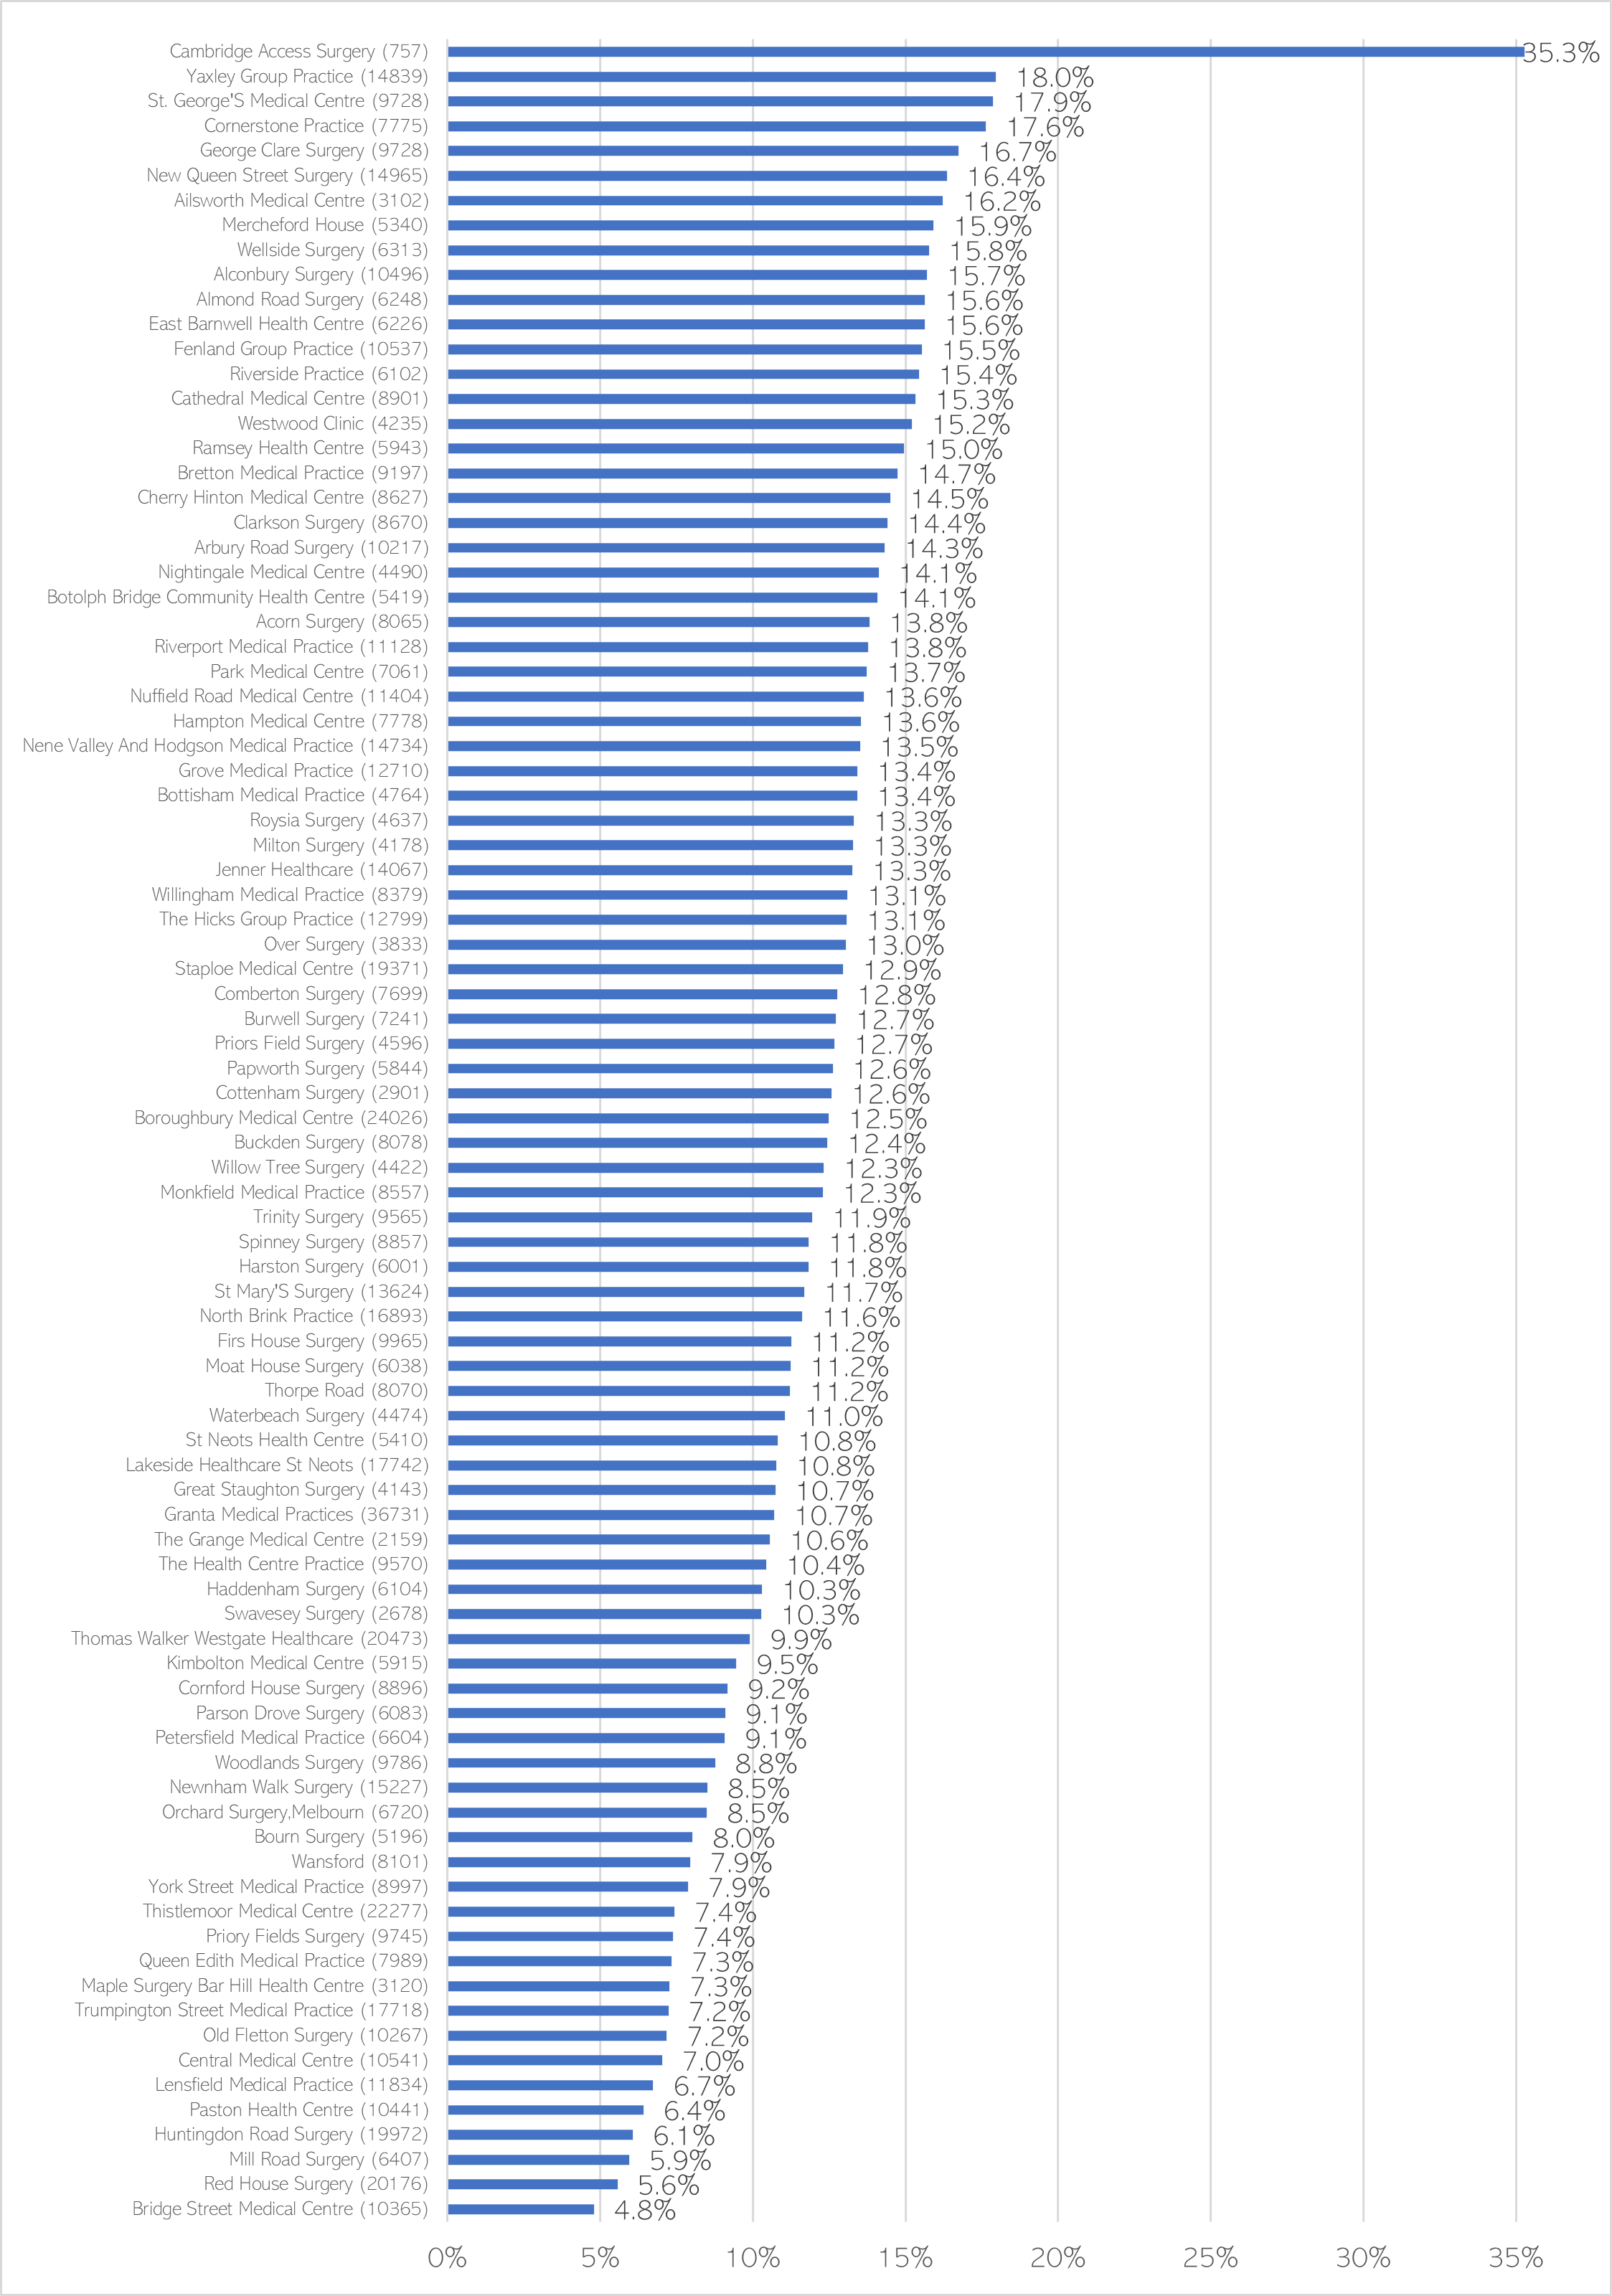
Figure 14: Prevalence of depression by GP practice in Cambridgeshire and Peterborough, recorded by primary care and shown as a percentage of GP practice population. Brackets show practice size (adults aged 18+). Data source: Quality and Outcomes Framework, 2022-23
There is a significant association between general practices deprivation and the number of patients on recorded as having depression in Cambridge, but not in Peterborough or other districts. As national data shows that depression prevalence is higher in more deprived areas (Hodgson et al., 2020; Remes et al., 2019), this may suggest that depression is underreported in some local areas.
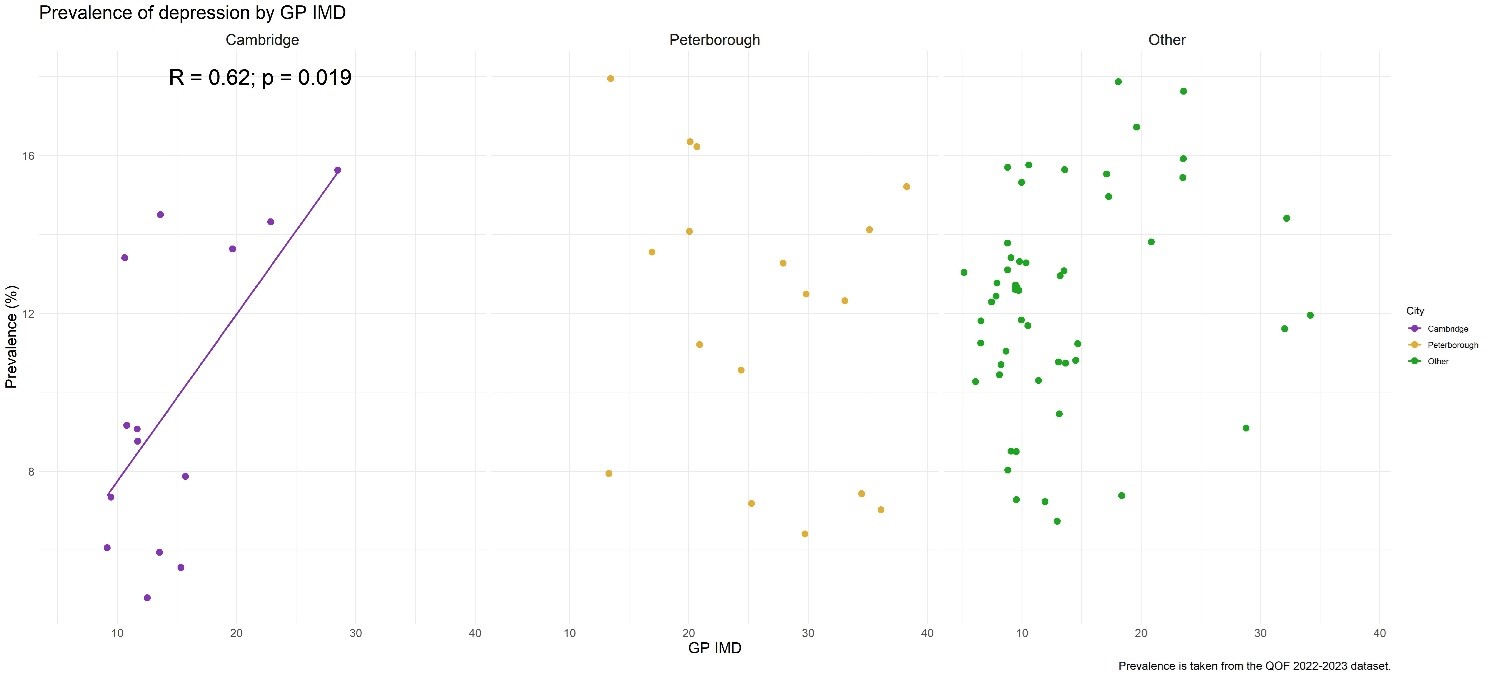
Figure 15: Prevalence of depression by general practice index of multiple deprivation (IMD). Data sources: QOF depression prevalence 2022/23, IMD scores 2019.
The following caveats apply to this analysis:
- The calculation of GP IMD is based on the location of the practice rather than a measure of their patient register. As such, a practice in a deprived area may not have a patient register from a similar deprivation, but instead a more mixed population.
- Given that there is a sizeable student population in Cambridge, it is worth considering that the Cambridge analysis may reflect two separate groups; a group of practices that cater to the student population that tends to be in less deprived areas of Cambridge (close to the colleges), and a group of practices that deal with the residential population. As the student population may be more homogeneous than their residential counterparts, they might not be comparable and should be considered separately.
Incidence
- From 2016/17 to 2021/22, the percentage of new diagnoses of depression was significantly lower than the national rates in Cambridgeshire and in Peterborough.
- In 2021/22, the percentage of patients aged 18+ with depression recorded for the first time in the year shows an increase in Cambridgeshire, Peterborough and England, compared to the previous year.
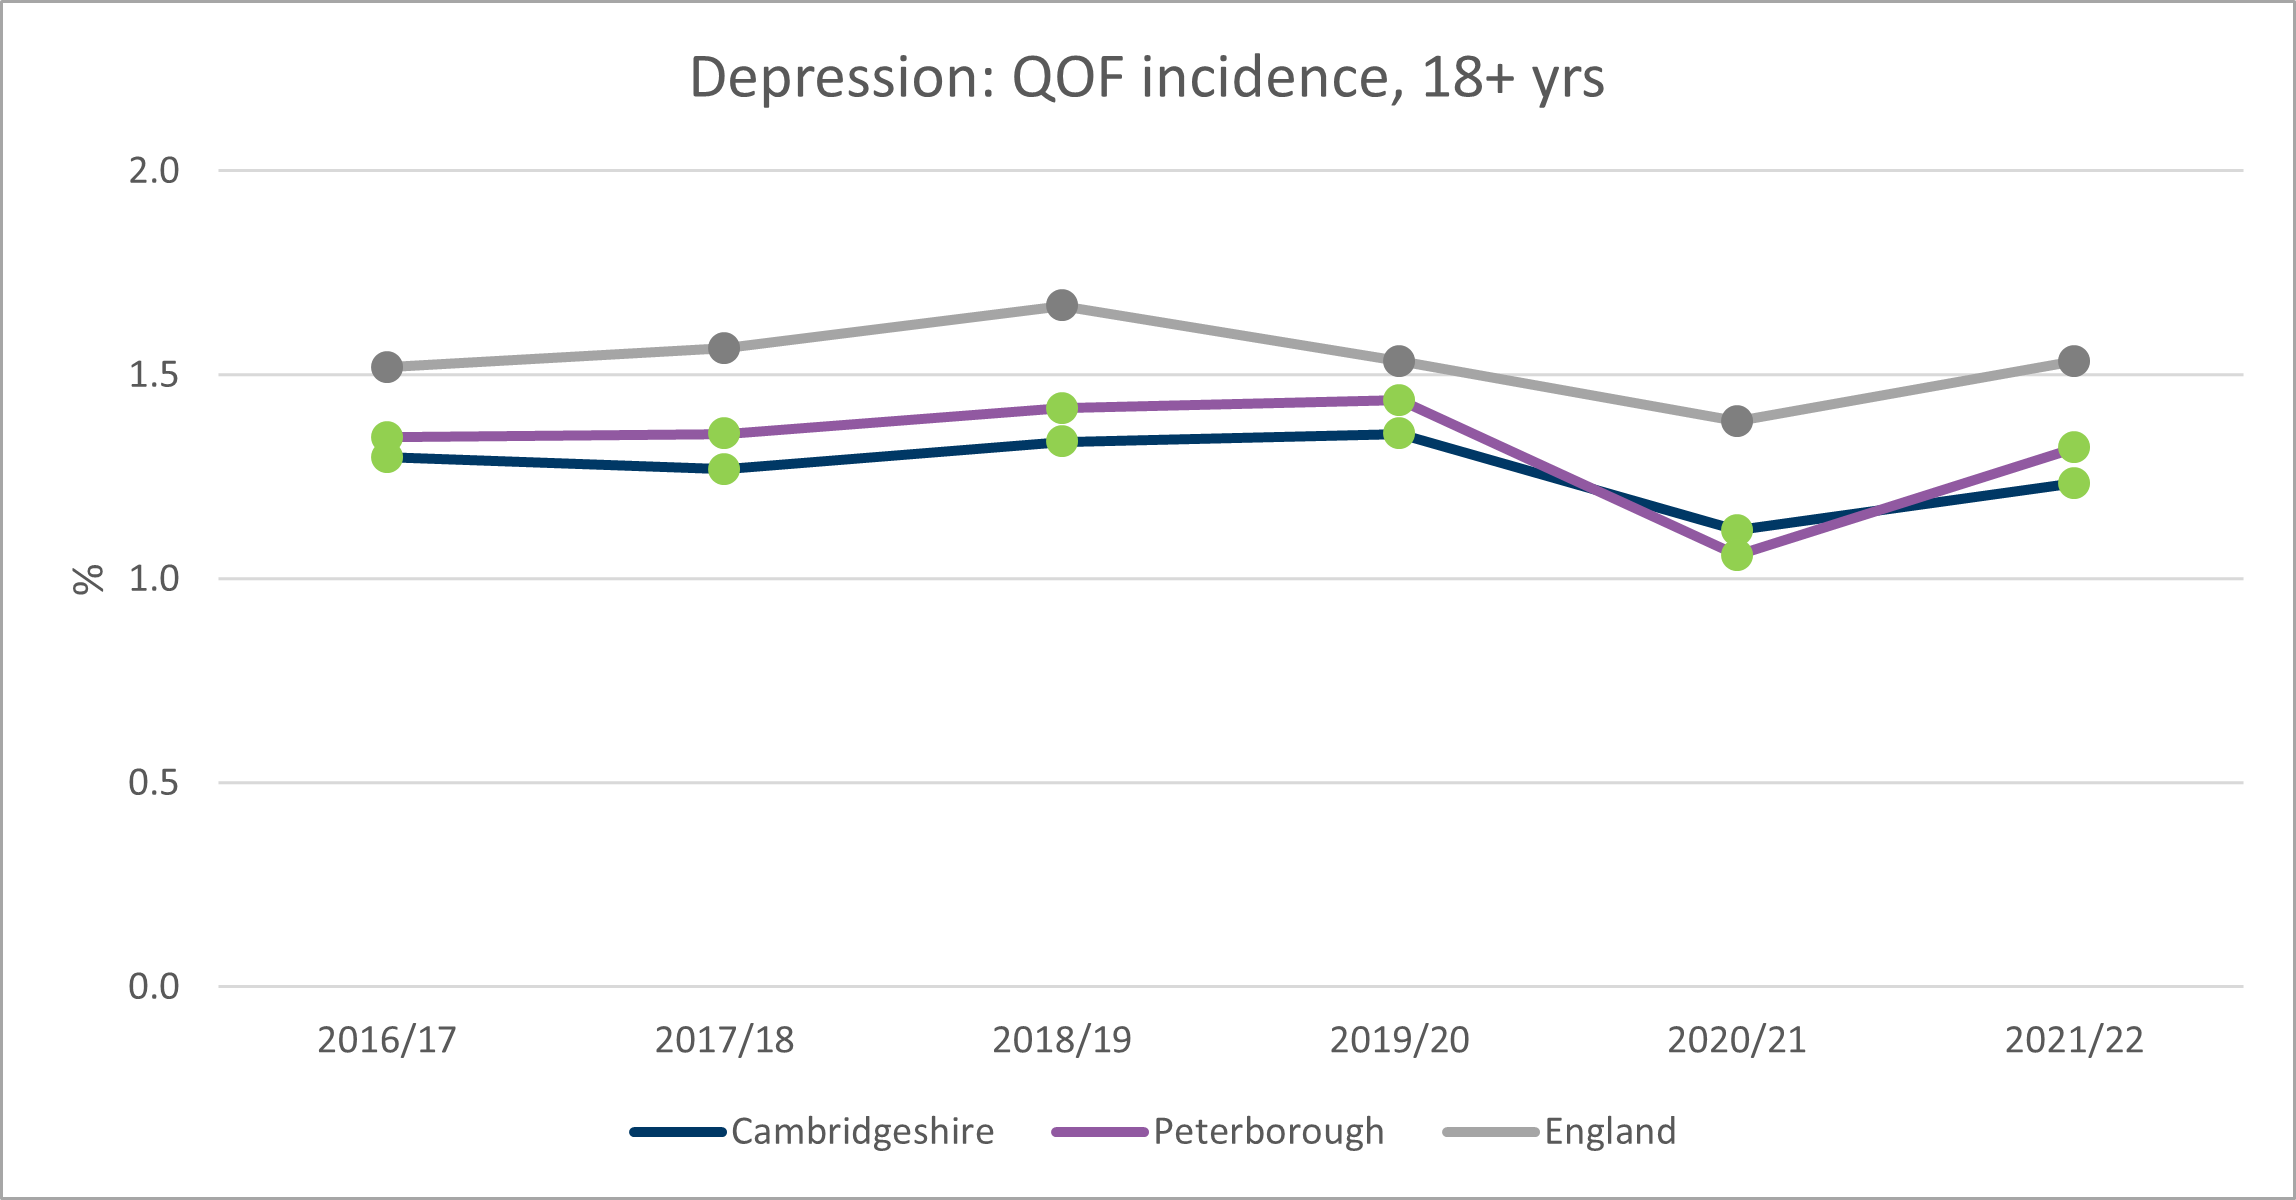
Figure 13: Depression incidence (recorded for the first time within the year) in adults as measured by primary care, Cambridgeshire and Peterborough, 2016/17 – 2021/22. Data source: NHS Digital
Hoarding
- The DSM defines hoarding disorder as ‘persistent difficulty discarding or parting with possessions, regardless of their actual value’, which leads to an accumulation of possessions that compromises the use or safety of living spaces (American Psychiatric Association, 2022). This was recognised as a mental health condition in 2013 (and 2017 in the World Health Organisation’s International Classification of Diseases (ICD-11)).
- Hoarding is recognised within the Care Act 2014 as a manifestation of self-neglect (Cambridgeshire and Peterborough Safeguarding Partnership Board, n.d.).
- Hoarding can also be a symptom of other physical and mental health problems, such as those relating to drug and alcohol use, dementia, depression and physical illness (Haighton et al., 2023; Samuels et al., 2008). Some studies suggest hoarding can be linked to neurodevelopmental conditions such as autism and ADHD (Nakao & Kanba, 2019).
- Severe hoarding can create serious risks to individuals, including risks to safety from falls and impeded fire escape routes (Postlethwaite et al., 2019). This can impact other members of the household, and in some cases neighbours.
- Hoarding contributes to a substantial economic cost to housing providers and Fire Services, although estimates for this cost varies (Neave et al., 2017).
- Stakeholders across the UK working with people with hoarding disorder highlight the need for multiagency approaches to intervention, often across health, housing, emergency services and social care (Haighton et al., 2023). For example, the local protocol for working with people with hoarding behaviours highlights that local authorities, NHS services, community sector organisations, social landlords and the fire service all work to reduce the risks associated with hoarding and to promote health and wellbeing.
- Early identification and support when hoarding issues may be seen as ‘clutter’ is important to reducing the impact this has on individuals. Evidence suggests that treatment of the underlying mental health need needs to take place before or alongside support with the decluttering process (Morein-Zamir & Ahluwalia, 2023).
Prevalence
- International research suggests that between 1.7 to 3.6% working-age adults may have hoarding disorder (Postlethwaite et al., 2019). Combining this estimate with data from the 2021 Census, this suggests there could be between 9,900 to 20,900 working-age adults in Cambridgeshire and Peterborough with hoarding disorder. This is similar or perhaps greater than the prevalence of obsessive-compulsive disorder (OCD) (National Institute for Health and Care Excellence, 2023).
- However, hoarding most often goes unrecognised:
- People who hoard do not tend to identify has as having hoarding issues. They may have varying levels of insight into their behaviour, but this can be compounded if they feel that they cannot trust people due to previous negative or judgemental responses.
- Hoarding behaviours often begin in early adulthood but may not be disclosed until decades later, or even at all (Morein-Zamir & Ahluwalia, 2023). Support services (including mental health services) may not identify someone has having hoarding issues until they visit their house.
- In Cambridgeshire and Peterborough, there was a 188% increase in the number of households identified as a hoarding risk by Fire and Rescue Service from 2019/20 to 2022/23. There was a sharp increase in 2021/22 and 2022/23, compared to before the pandemic.
- A lower number of households were identified in 2020/21 compared to other years, which is likely due to the impact of the COVID-19 pandemic and lockdowns.
- The number of households identified as a hoarding risk varies by district, although Huntingdonshire is consistently one of the highest areas.
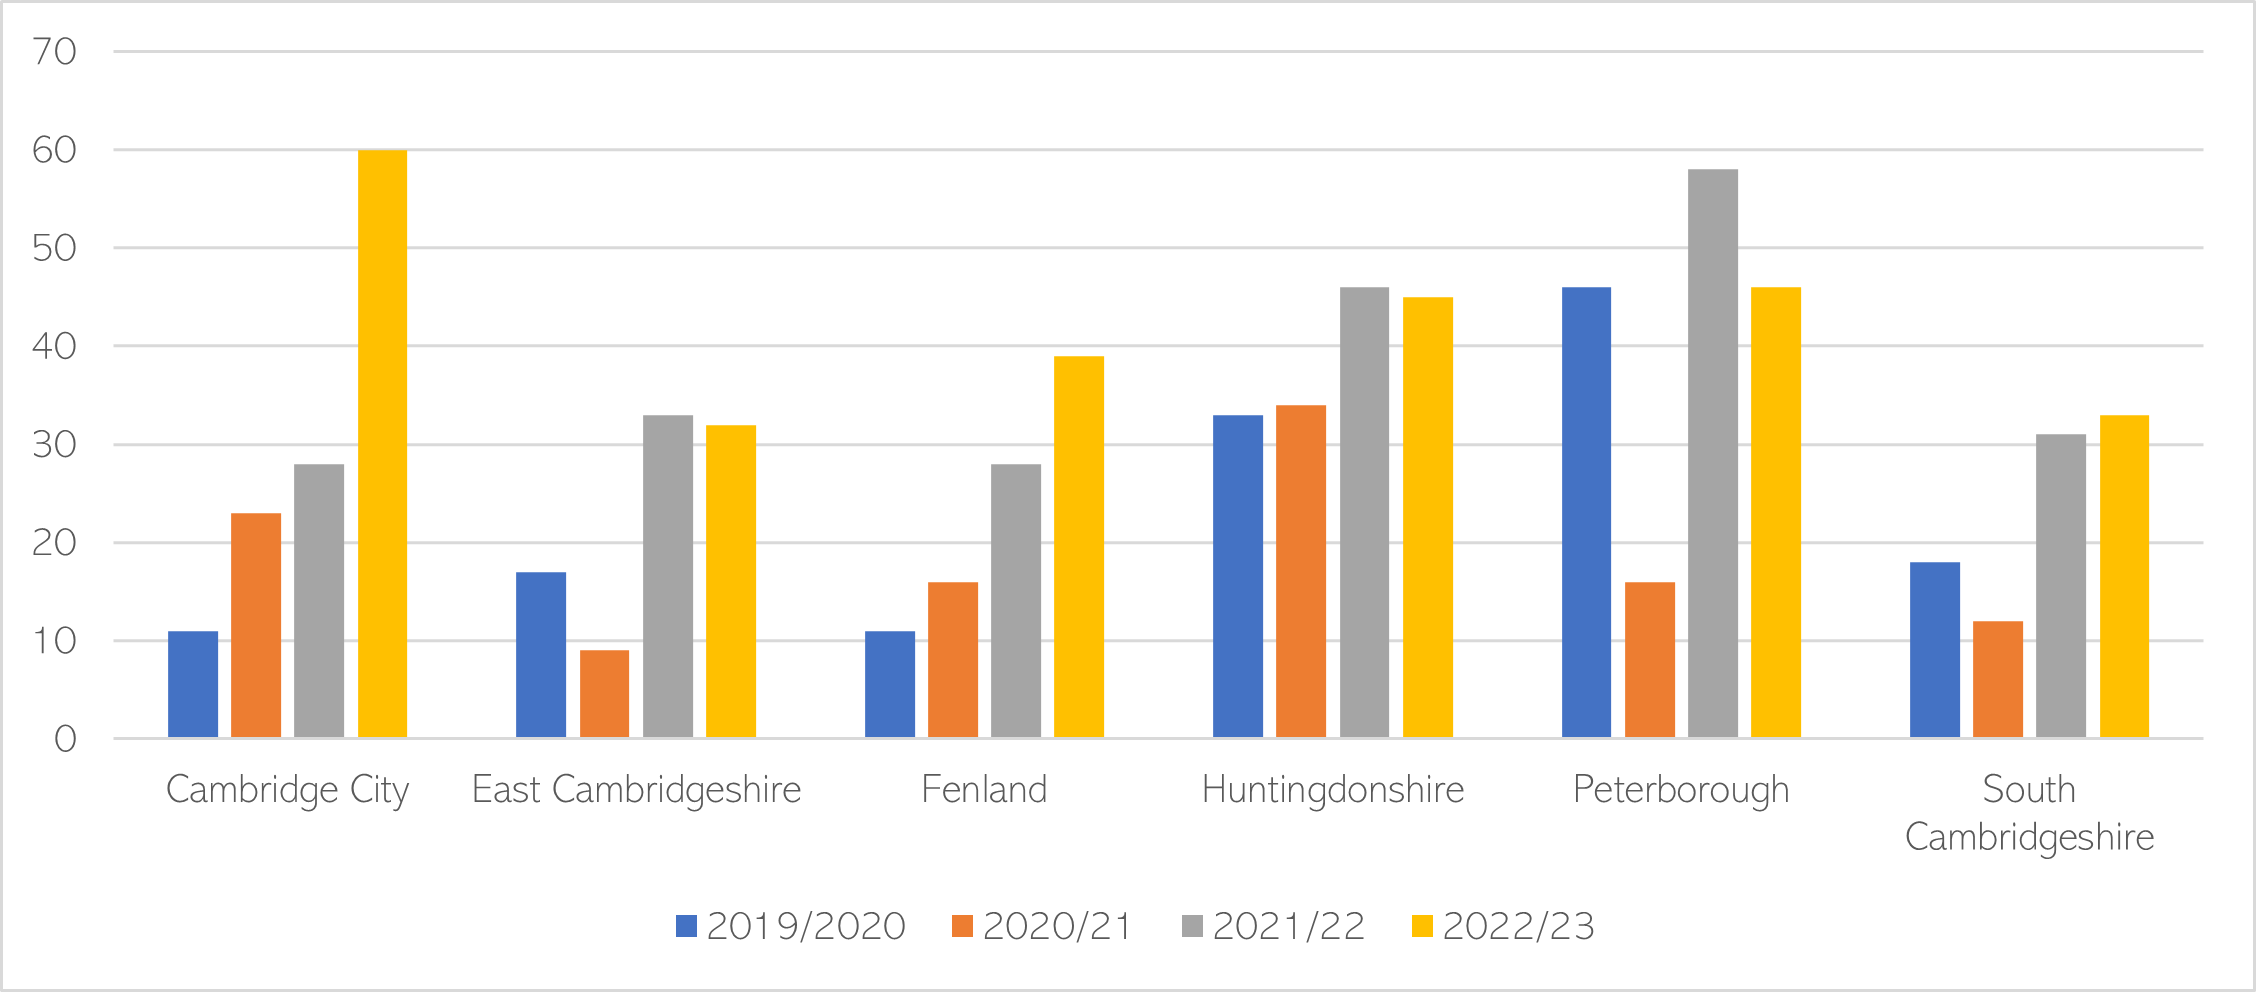
Figure 16: Total number of households identified as a hoarding risk by district, 2019/20 – 2022/23. Data source: CFRMIS. Note that this data only includes households where a hoarding referral was made, or a hoarding risk was identified during a visit. These are distinct households and may have one or more hoarding job associated with them.
Self-reported mental illness
1 in 8 people (12.5%) within Cambridgeshire and Peterborough ICS reported having a long-term mental health condition in the 2023 GP Patient Survey. There has been a steady increase in the proportion of people self-reporting a mental health condition from 2020, in line with national trends.
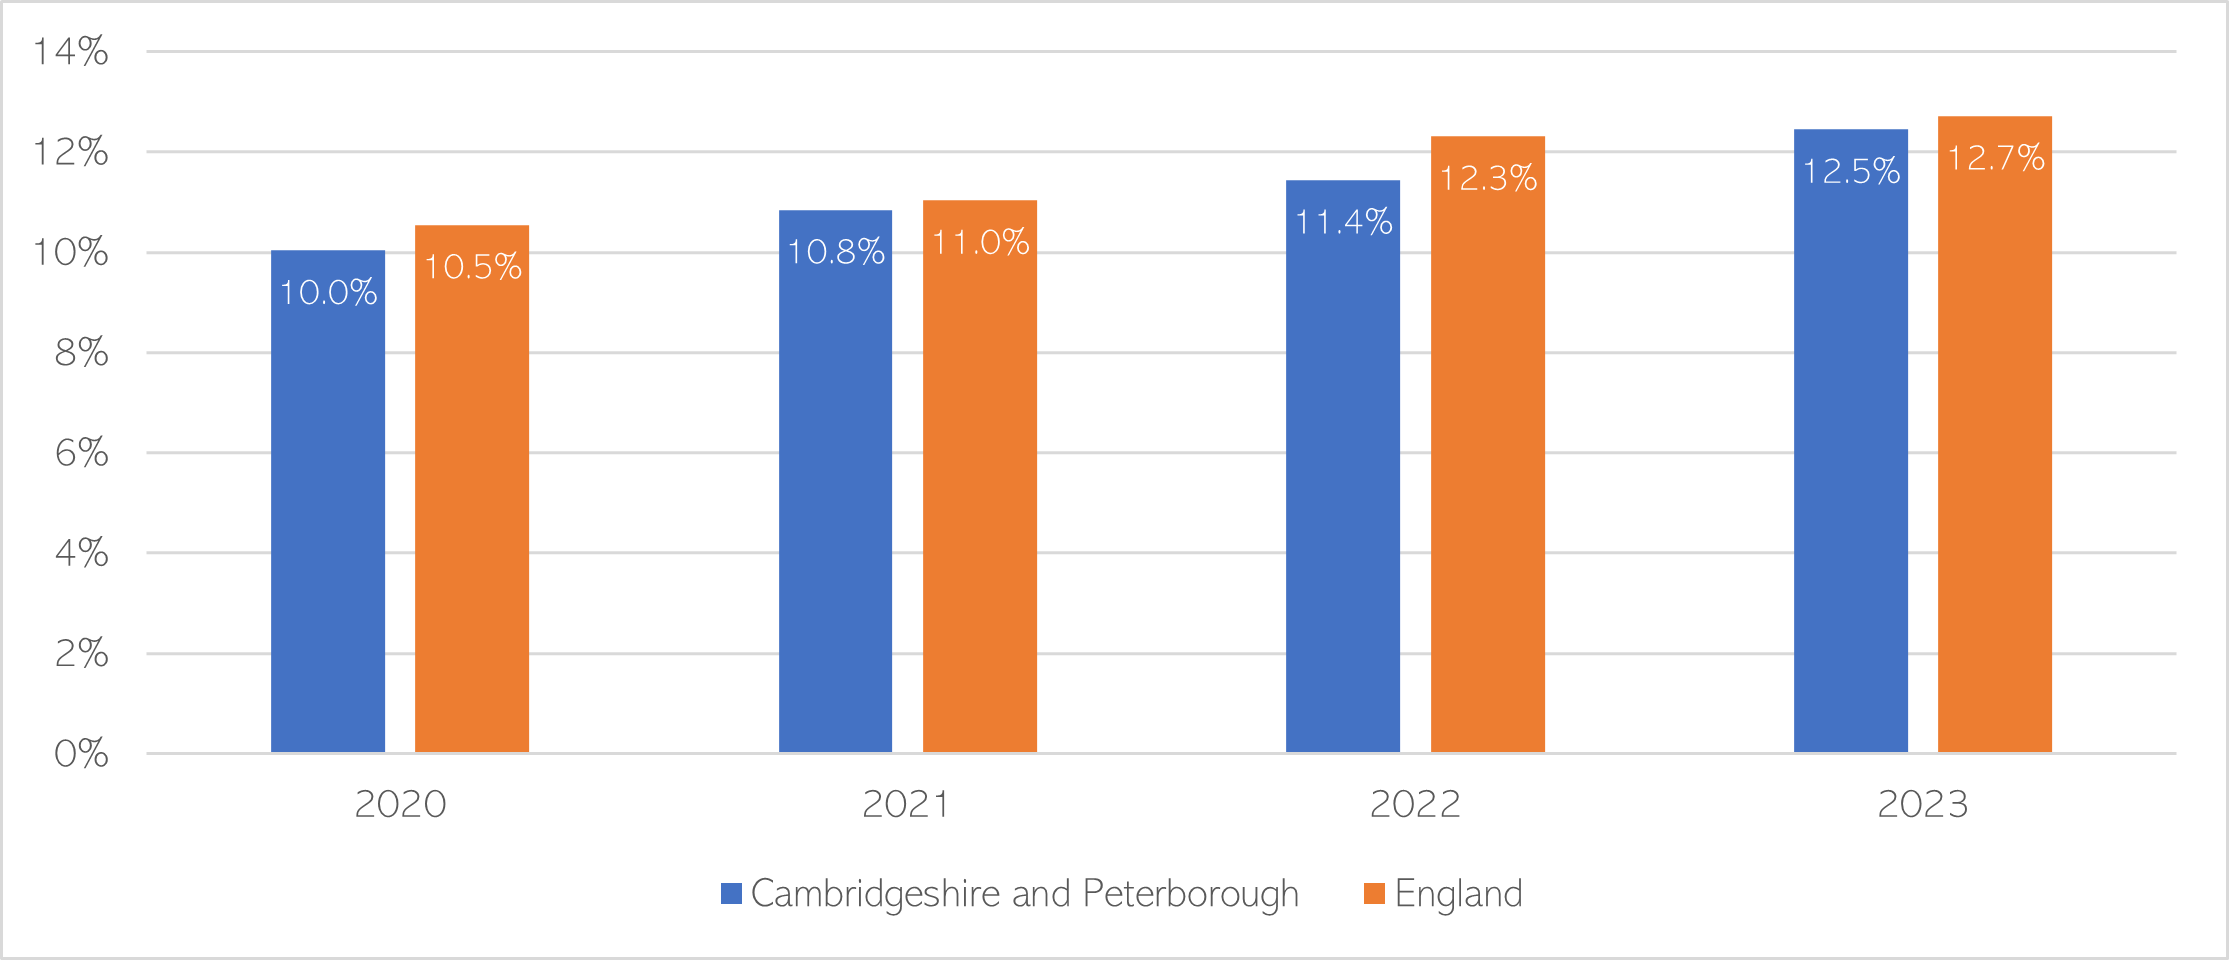
Figure 17: Weighted proportion of GP Patient respondents who self-reported having a ‘long-term mental health condition’, 2020 – 2023. Data source: GP Patient Survey
Severe mental illness
In Cambridgeshire and Peterborough, there were 8,695 adults on the SMI register in 2022/23, which is equivalent to 0.84% of the adult population (aged 18+) who are registered with GPs (NHS Digital, 2023c). Comparatively, 1.00% of adults in England are on the SMI register (NHS Digital, 2023c).
Prevalence
- The proportion of people on the SMI register has been significantly lower than the national average since 2016/17 in all districts apart from Cambridge.
- The prevalence in Cambridge has declined in recent years and is now statistically similar to the national rate.
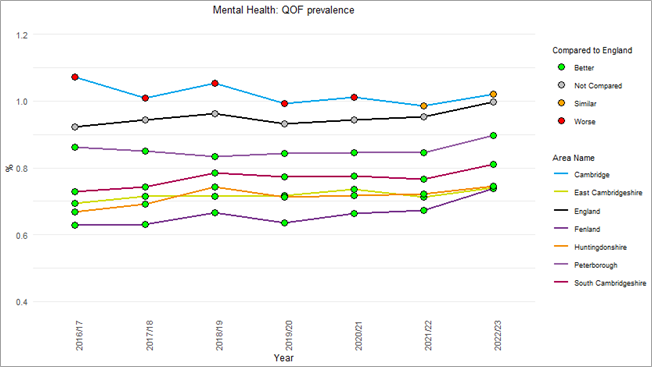
Figure 18: % of patients with schizophrenia, bipolar affective disorder and other psychoses as recorded on general practice disease registers, Cambridgeshire and Peterborough, 2016/17 – 2022/23. Data source: Fingertips
How accurate is the SMI register?
- In Cambridgeshire and Peterborough, it is estimated that the register covers 85.5% of people we would expect to see with severe mental illness in our local population (NHS England, 2023d).
- In comparison, nationally the SMI register covers 89.5% of people we would expect to have SMI (NHS England, 2023d).
Is there a link between deprivation and the prevalence of severe mental illness?
National research shows that there are higher levels of severe mental illness in more deprived areas (Grigoroglou et al., 2019). In Cambridge and Peterborough, there is a non-significant association between deprivation and number of people on GP practices severe mental illness (SMI) registers.
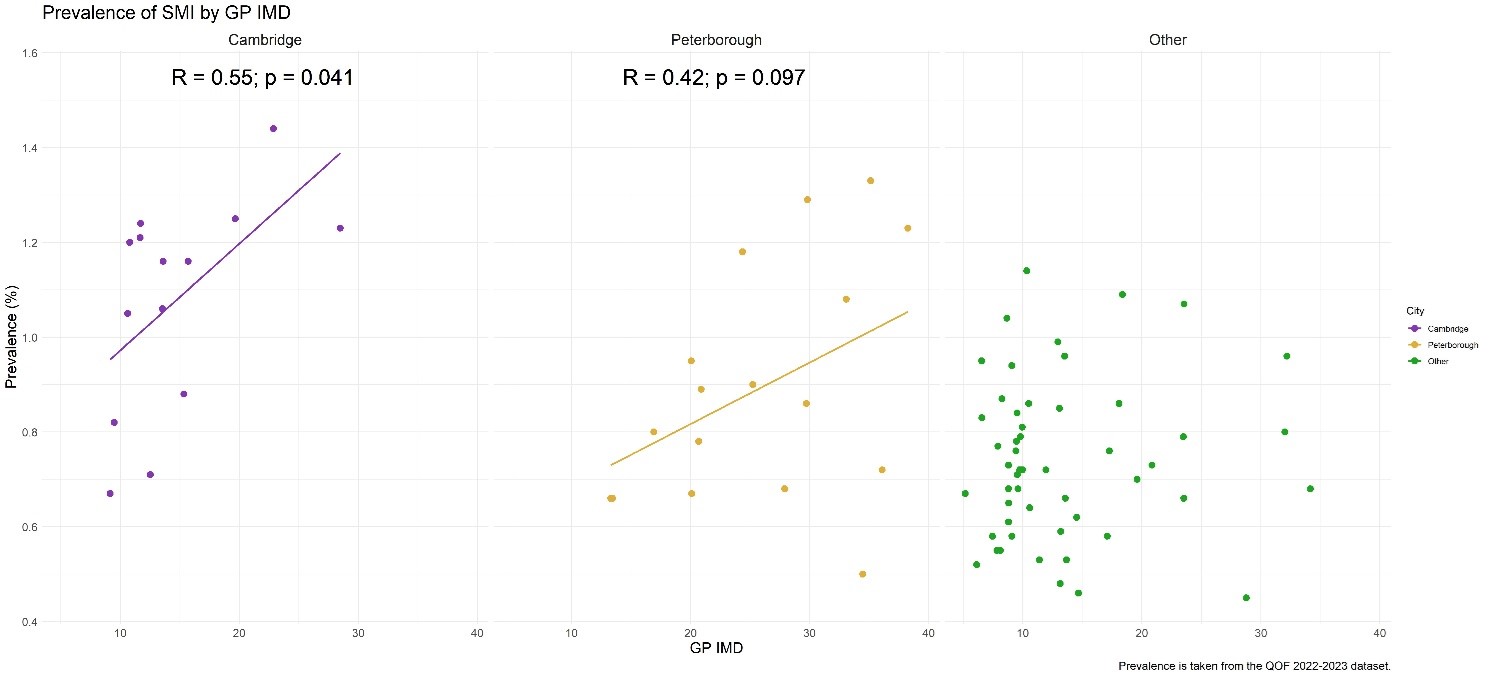
Figure 19: Prevalence of severe mental illness by general practice index of multiple deprivation (IMD). Data sources: QOF SMI prevalence 2022/23, IMD scores 2019.
The following caveats apply to this analysis:
- The calculation of GP IMD is based on the location of the practice rather than a measure of their patient register. As such, a practice in a deprived area may not have a patient register from a similar deprivation, but instead a more mixed population.
- Given that there is a sizeable student population in Cambridge, it is worth considering that the Cambridge analysis may reflect two separate groups; a group of practices that cater to the student population that tends to be in less deprived areas of Cambridge (close to the colleges), and a group of practices that deal with the residential population. As the student population may be more homogeneous than their residential counterparts, they might not be comparable and should be considered separately.
- Peterborough may demonstrate a degree of heteroscedasticity as there appears to more variance in the higher deprivation areas than in the low deprivation areas. However, Bartlett test is non-significant when grouping IMD into high and low categories, though a median split may not be the most sensitive method of conducting this analysis.
Additional resources
- Hoarding:
- Cambridgeshire guidance on hoarding
- Cambridgeshire and Peterborough Multi-agency Protocol for Working with People with Hoarding Behaviours
- Hoarding: Key considerations and examples of best practice
- Centre for Collaborative Research on Hoarding
- A Psychological Perspective on Hoarding: DCP Good Practice Guidelines
References
Full list of references is included at the end of this chapter.