Data on self-harm
- Data across national surveys consistently highlight that self-harm predominantly affects children and young people (ages 10-24), with significantly higher levels seen in females than males. Latest data estimates that the prevalence of adults who have ever engaged in self-harm is around 6.4% (2014 APMS) vs 36.8% for young people aged 17 to 24 years (2023 MHCYP) and 45.7% for your women (2023 MHCYP).
- Nationally, there is some evidence that reported self-harm is increasing among young people. However, local Health-Related Behaviour School Survey data indicate that reported self-harm in Peterborough has remained stable between 2022 and 2024, while Cambridgeshire has experienced a slight decline.
- Local hospital data shows that both A&E attendance and hospital admissions for self-injurious have been on a consistent decline.
- Local A&E attendances for self-injurious behaviour are around twice as high for females as for males.
- C&P ICB North has approximately 1.5 times higher admission rates compared the South. Note: The Cambridgeshire and Peterborough ICS is split in two Partnerships – North (Peterborough, Fenland, Huntingdonshire) and South (Cambridge City, South Cambridgeshire, East Cambridgeshire). Further details here.
- C&P Admission rates for self-injurious behaviour generally highest in the two most deprived quintiles and lowest in the two least deprived quintiles.
- Locally, a very small proportion of patients (less than 1% of total patients) who attended more than 10 times and accounted for 12% of the total A&E attendances.
- From local liaison psychiatry data review of ‘self-injurious behaviour’, A&E attendances primarily relate to suicide attempts, ideation, and overdoses rather than self-harm, consistent with national findings that hospital data underrepresents self-harm.
National survey data
From the latest 2014 Adult Psychiatric Morbidity Survey (APMS), it is estimated that 6.4% of the UK population aged 16-74 have ever engaged in self-harm. However, the rate rises to 25.7% in women aged 16–24, which is about twice the rate for men in this age group (9.7%) as illustrated in Figure 4 (29). The majority reported that they did not seek professional help afterwards (29). (Note that the APMS survey questions is “Have you ever deliberately harmed yourself in any way but not with the intention of killing yourself?”)
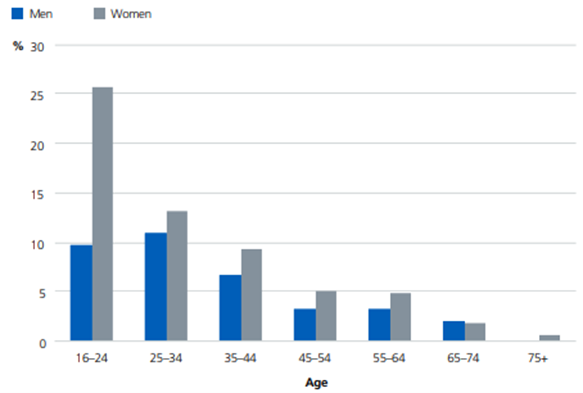
Figure 4: Self-harm without suicidal intent ever, by age and sex. Source: APMS, 2014 (29)
From the latest 2023 survey of Mental Health of Children and Young People in England, 36.8% (32.8% in 2022) of young people aged 17 to 24 years had ever tried to harm themselves (45.7% in young women versus 28.8% in young men) and 4.8% had self-harmed in the last 4 weeks (30). Although not directly comparable due to different methodologies, compared to the APMS data from 2014, this data suggests a substantial increase in reported self-harm among young people. This may stem from shifts in how self-harm is defined, with a wider range of self-injury now being recognised as self-harm (29). Additionally, people may feel more comfortable disclosing self-harm due to its increasing normalisation and reduced stigma (28). However, this increase could also reflect an actual rise in self-harming behaviour.
For younger children aged 7-16, parent-reported self-harm rates in 2023 estimated that 9.4% had self-harmed at least once, up from 7.8% in 2022 (30).
According to the 2022 WHO Health Behaviour in School-aged Children study for England, over a third (34% overall) of 15-year-olds reported having deliberately self-harmed at some point in their lives (31). This rate was notably higher among girls (49%) compared to boys (20%) and these figures reflected a significant increase from previous years, rising from 22% in 2014 and 25% in 2018.
The majority of self-injury (with or without suicidal intent) includes episodes involve cutting, and less common methods include burning, hanging, stabbing, drowning, swallowing objects, insertion, shooting, and jumping from heights or in front of vehicles (7). Methods of self-harming also vary with young people (16 to 34 years) were more likely than their older counterparts to report cutting or burning themselves, whereas older people being more likely to report swallowing something or some other method than cutting or burning (29).
Nationally, for three-quarters (76.7%) the reported reason for self-harming was to relieve unpleasant feelings whilst a third reported self-harming to draw attention to their situation (29).
Health-Related Behaviour School Survey
In 2024, over 2,100 Peterborough pupils and 6,955 Cambridgeshire pupils from Year 8 and 10 (ages 12-15) took part in the Health-Related Behaviour Survey (32):
- In Peterborough, 22% of year 8 pupils and 17% of year 10 pupils reported at least ‘sometimes’ they cut or hurt themselves when they have a problem. Significantly higher levels are reported amongst females (29%) compared to males (10%). Overall, 20% of the Peterborough pupils reported they cut or hurt themselves when they have a problem (19% in 2022). There is no statistically significant change in the rate between 2022 and 2024 for Peterborough.
- In Cambridgeshire, 19% of Year 8 and 19% of Year 10 pupils reported at least ‘sometimes’ they cut or hurt themselves when they have a problem. Significantly higher levels are reported amongst females (27%) compared to males (10%). Overall, 19% of the Cambridgeshire pupils reported they cut or hurt themselves when they have a problem (22% in 2022). The 2024 rate is statistically lower than the 2022 rate for Cambridgeshire.
A&E attendances
Local hospital data analysis provides trends for the C&P resident A&E attendances (including UTC attendances) for self-injurious behaviour. Note: this was defined by external cause codes (ICD10 codes X60 to X84) which include: Intentional self-poisoning (X60 to X69 inclusive), Intentional self-harm by hanging, drowning or jumping (X70, X71 and X80), Intentional self-harm by firearm or explosive (X72 to X75 inclusive), Intentional self-harm using other implement (X78 and X79), Intentional self-harm other (X76, X77 and X81 to X84) (35).
No England benchmarks were available for A&E attendances for self-injurious behaviour but are available for hospital admissions for self-injurious behaviour. Key points on A&E attendances include:
- C&P A&E attendance rates for self-injurious behaviour have been on a steady decline between 2021/22 and 2023/24 (Figure 5), consistent with admissions trends shown below.

Figure 5: A&E attendance for self-injurious behaviour (all ages), directly age standardised rate per 100,000, C&P ICB, 2018/19-2023/24. Source: ICB DSCRO dataset
- When analysed by ICB area and local authority (Figure 6-7), A&E attendance rates recorded for self-injurious behaviour are around 3 times higher in South compared to North and similarly higher in Cambridgeshire compared to Peterborough. It is difficult to conclude if this reflects differences in need as self-harm is coded differently in A&E across the North and South. For example, significantly more attendances are re-coded as self-harm after hospital admission in the North (self-harm admission rates are approximately 1.5 times higher in the North, despite the South recording three times higher A&E attendance rates for self-injurious behaviour). This pattern suggests potential under-coding at the A&E level in the North. Confirming this would requires further investigation or an audit of coding practices between hospitals in the two regions.
- When data is broken down at PCN level, Wisbech Primary Care Network (PCN) reports the highest A&E attendance rate in the North (just under 200 per 100,000). However, nearly all PCNs in the South have significantly higher rates compared to those in the North, with Cambridge City PCN showing the highest rate by far (over 600 per 100,000). By district level, Cambridge City, East Cambridgeshire and South Cambridgeshire have by far the highest rates in C&P. As these are age-standardised rates, differences observed cannot be attributed directly to demographic variations such as a younger population in Cambridge City.

Figure 6: A&E attendance for self-injurious behaviour (all ages) by gender ICB area, directly age standardised rate per 100,000, C&P ICB, 2018/19-2023/24. Source: ICB DSCRO dataset
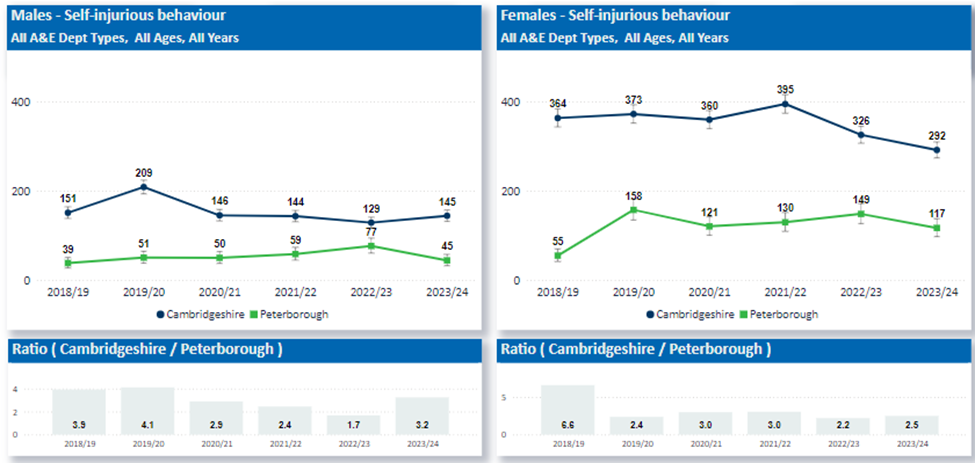
Figure 7: A&E attendance for self-injurious behaviour (all ages) by gender and upper-tier local authorities, directly age standardised rate per 100,000, C&P ICB, 2018/19-2023/24. Source: ICB DSCRO dataset
- Combined analysis of North and South data together reveals higher rates of A&E attendances recorded as being due to self-harm in the least deprived areas. This contrasts with total C&P A&E attendances (encompassing both physical and mental health) and A&E attendances specifically related to mental health, and national data, which indicating that individuals in more deprived areas are more likely to attend A&E (33) (34).
- When broken down by North and South area, there are significantly higher rates of A&E attendance recorded for self-harm in the most deprived quintile compared to the least deprived quintile in the South, whilst rates are statistically similar between the most and least deprived areas in the North (Figure 8). This reversal between combined North and South deprivation pattern and the broken-down pattern occurs because the South, which is much less deprived overall than the North, has significantly higher A&E attendance rates.
Figure 8: A&E attendance for self-injurious behaviour (all ages) by IMD quintile, directly age standardised rate per 100,000, C&P ICB, 2018/19-2023/24. Source: ICB DSCRO dataset

Figure 9: A&E attendances relating to mental health (anxiety; bizarre behaviour; c/o – feeling depressed; depressed mood; depressive disorder; self-injurious behaviour; substance misuse; suicidal thoughts), by IMD quintile, directly age standardised rate per 100,000, C&P ICB, 2018/19-2023/24. Source: ICB DSCRO dataset.

Figure 10: All A&E attendance by IMD quintile, directly age standardised rate per 100,000, C&P ICB, 2018/19-2023/24. Source: ICB DSCRO dataset.
- Female A&E attendance rates for self-injurious behaviour are over twice as high as for males (Figure 11). Consistent with national survey data above, the rates are particularly pronounced for young females aged 10-29.

Figure 11: A&E attendance for self-injurious behaviour (all ages) by gender and age, directly age standardised rate per 100,000, C&P ICB, 2018/19-2023/24. Source: ICB DSCRO dataset
- In terms of repeat attendances for self-injurious behaviour in 2023/2024, the majority of patients (82%) attended once and around 12% of patients attended twice. However, there was a very small proportion of patients (less than 1% of total patients) who attended more than 10 times and accounted for 11% of the total attendances.
- The majority of A&E attendances for self-injurious behaviour were either by ambulance or self-referral, with an approximately equal split between the two sources. The most common discharge destination was home (about 70% from 2021/22 to 2023/24), followed by admissions to a ward (around 20% during the same period). However, this admission rate underestimates the true extent of self-injurious behaviour as not all patients admitted from A&E for self-injurious behaviour are initially coded as such. For instance, in 2023/24, of the 953 admissions from A&E linked to self-injurious behaviour, over 600 were not recorded under this category at the point of A&E entry but were recoded upon admission. Accounting for these adjustments, the actual admission rate for self-injurious behaviour is closer to 40% in 2023/24.
Hospital admissions
C&P hospital admissions data for intentional self-harm, comparable to national England rates, is shown in Figure 12 (all ages) and Figure 13 (ages 10-24). From local analysis, admissions for self-injurious behaviour are almost entirely from A&E (97% in 2021/22-2023/24). Key points include:
- All-Age Self-Harm Admission Trends: All-age self-harm admission rates in Cambridgeshire and Peterborough have decreased substantially in recent years (Figures 12-13). From both areas being significantly above national rates in 2019/20, Cambridgeshire rates fell below national levels in 2022/23, while Peterborough rates are now similar to national. Admissions per 100,000 in Peterborough more than halved from 303 in 2015/16 to 130 in 2022/23; Cambridgeshire rates also more than halved over the same period, from 261 to 106. This decline somewhat mirrors the national downward trend over the last few years, but the decline locally has been more pronounced.

Figure 12: Emergency Hospital Admissions for Intentional Self-Harm (all ages), directly age standardised rate per 100,000, C&P compared to England, 2010/11-2022/23. Source: Fingertips, Suicide Prevention Profile (35)

Figure 13: Hospital admissions for self-injurious behaviour (all ages), directly age standardised rate per 100,000, C&P ICB, 2018/19-2023/24. Source: ICB DSCRO dataset
- 10-24 Self-harm Admission Trend: Self-harm hospital admissions for young people are significantly higher than those for older adults, both locally and nationally (Figures 14). In Cambridgeshire, 10-24 admission rates per 100,000 fell sharply from 547 in 2019/20 to 319 in 2022/23, aligning with the national average. In Peterborough, however, rates for young people remain relatively unchanged and significantly above the national average, at 473 in 2022/23. Local analysis shows that similar to A&E attendances, the rates are particularly pronounced for young females aged 10-19 (Figure 15).
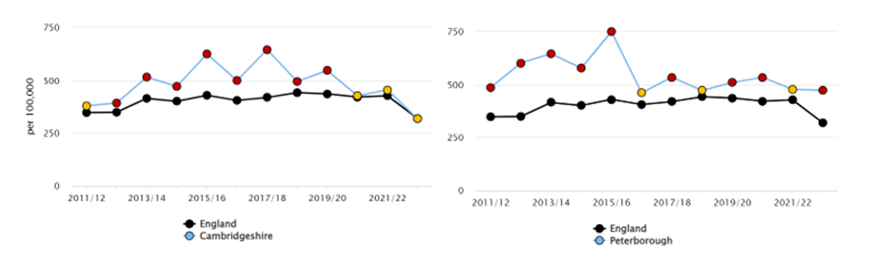
Figure 14: Hospital admissions as a result of intentional self-harm (10-24 years), directly age standardised rate per 100,000, C&P compared to England, 2011/12-2021/22. Source: Fingertips, Suicide Prevention Profile (35)
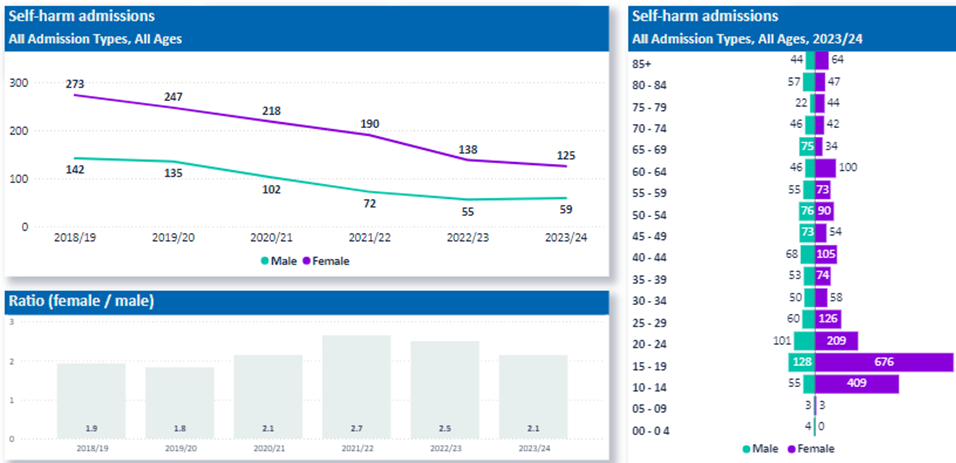
Figure 15: Hospital admissions for self-injurious behaviour (all ages) by gender and age, directly age standardised rate per 100,000, C&P ICB, 2018/19-2023/24. Source: ICB DSCRO dataset
- Local analysis reveals a significant geographical variation between C&P ICB areas, with a pattern opposite to that seen in A&E attendances. Specifically, C&P ICB North has approximately 1.5 times higher admission rates compared the South. However, there is no significant difference when comparing Cambridgeshire and Peterborough local authority rates.
 Figure 16: Hospital admissions for self-injurious behaviour (all ages) by gender and North vs South Place, directly age standardised rate per 100,000, C&P ICB, 2018/19-2023/24. Source: ICB DSCRO dataset
- Admission rates in C&P are higher in the most deprived quintile compared to the least deprived quintile (Figure 17). This is broadly consistent with England pattern by deprivation deciles, although the national trend is not linear or consistent across years (e.g., in 2021/22 in England the top and bottom deciles had lower admission rates than the middle deciles) (36).
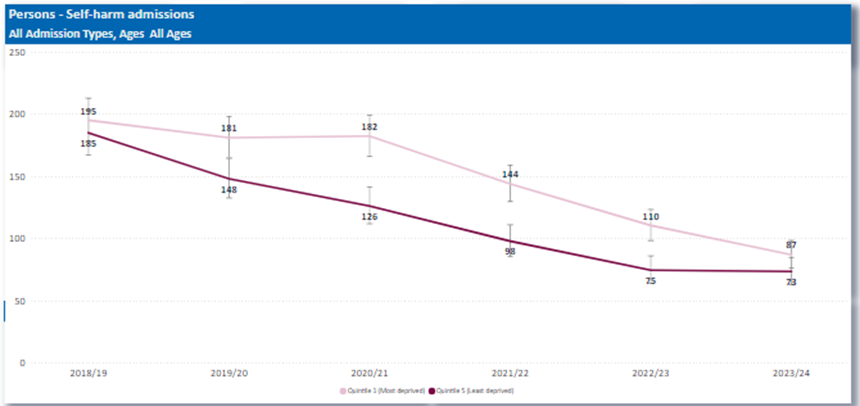
Figure 17: Hospital admissions for self-injurious behaviour (all ages) by IMD, directly age standardised rate per 100,000, C&P ICB, 2018/19-2023/24. Source: ICB DSCRO dataset
- In 2023/2024, the majority of patients (87%) were admitted once and around 9% of patients admitted twice. Unlike A&E attendances, admissions with 3 or more repeats was less common (around 4%).
Understanding the downward trend in hospital admissions for self-harm (all ages), both locally and nationally, is challenging. This decrease could reflect a genuine reduction in less severe self-harm cases requiring admission. Alternatively, it might result from changes in hospital admission criteria or increased mental health specialist support within A&E department (e.g., the 2016 Five Year Forward View for Mental Health recommended a liaison psychiatry service that operates 24/7 by 2020-2021) or alternative community services, which may reduce the need for self-harm admissions.
Liaison psychiatry
Routine hospital data does not distinguish between self-harm and attempted suicide. To gain insights, data from liaison psychiatry was reviewed for this needs assessment. As this required a line-by-line analysis of coding to identify patterns, only the most recent 2023 A&E data for North West Anglia Foundation Trust (NWAFT) and Cambridge University Hospitals (CUH) was analysed, focusing on residents of Cambridgeshire and Peterborough (all ages). Differences in the local population, hospital size, systems and coding fields between the two trusts mean the numbers and categorisation is not always directly comparable. Key findings:
- Self-injurious behaviour split. In 2023, 63% of A&E patients seen by liaison psychiatry at CUH and 75% at NWAFT were linked to self-harm, suicide attempts, suicidal ideation, or overdose (Table 7). Despite differences in proportions, both trusts revealed that A&E attendances primarily relate to suicide attempts, ideation, and overdoses rather than self-harm, consistent with national findings that hospital data underrepresents self-harm (28).
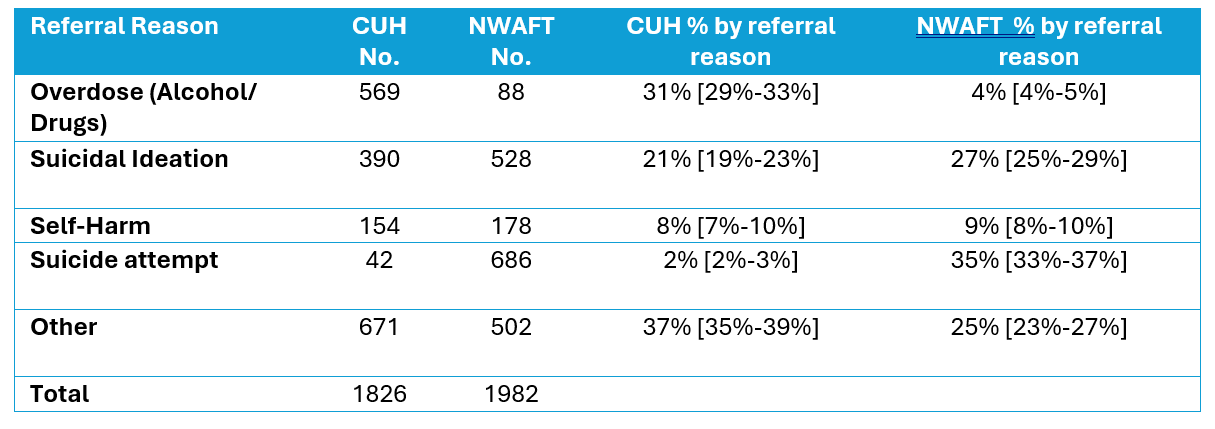
Table 7: CUH & NWAFT A&E Liaison Psychiatry 2023 data with 95% Confidence Intervals in square brackets, calculated using the normal approximation method. Source: CPFT analysis