In this data story, we highlight some of key findings from Cambridgeshire’s and Peterborough’s 2023-24 housing completions data, as well as taking a look at trends in completions since 2011-12.
Cambridgeshire County Council’s Communities and Demography Team within Policy and Insight works closely with district and city council partners to collect this data. An overview for the Cambridgeshire and Peterborough area as a whole is provided below. Much of the data was gathered through site visits and cleaned by the Communities and Demography PI Team. This data is published on Cambridgeshire and Peterborough Insight and includes a range of data relating to the number of new dwellings completed by district, parish, settlement, bedrooms, previously developed land, affordability and density.
If you have any questions regarding the data story or the data used, please contact Policyandinsight@cambridgeshire.gov.uk
Net Housing Completions by Local Authority (2012-24)
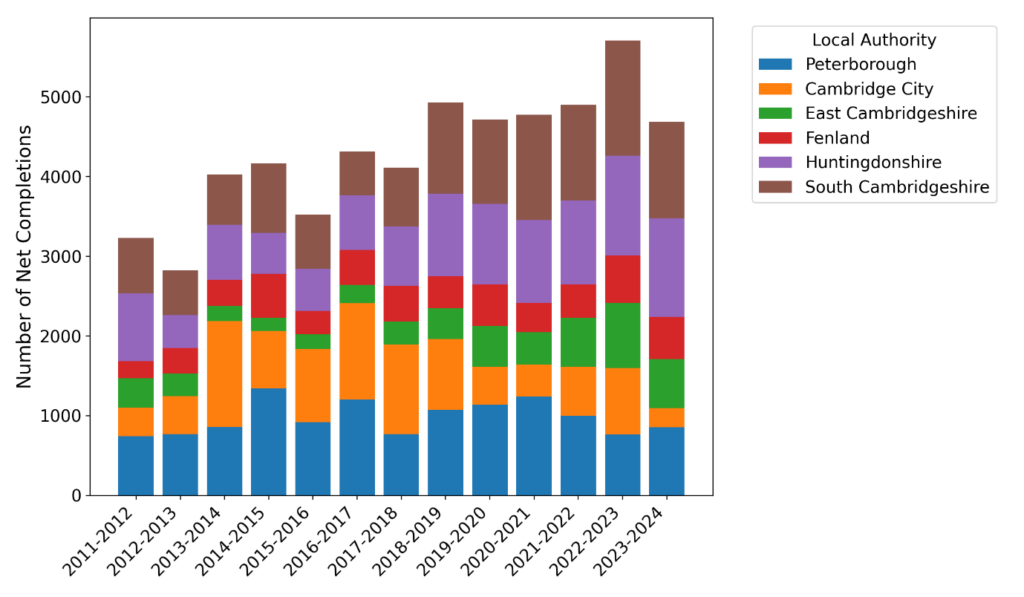
The Chart above shows the net number of completed dwellings built in Cambridgeshire and Peterborough in each financial year between 2011-12 and 2023-24. Following very high net completions (5,707) in 2022-23, net completions were lower in 2023-24 (4,683) and more similar to levels seen in the four years before 2022-23.
In 2023-24, the completion of new dwellings was concentrated in Huntingdonshire, South Cambridgeshire, and Peterborough, each accounting for just over 25% of the total. Each local authority experienced a decrease in net completions compared to the previous year, with the exception of Peterborough (+12%). Cambridge (-71%) saw the largest fall in year-on-year completions and Huntingdonshire saw the smallest fall in year on year completions (-1%).
Gross Housing Completions by Bedrooms (2019-24)
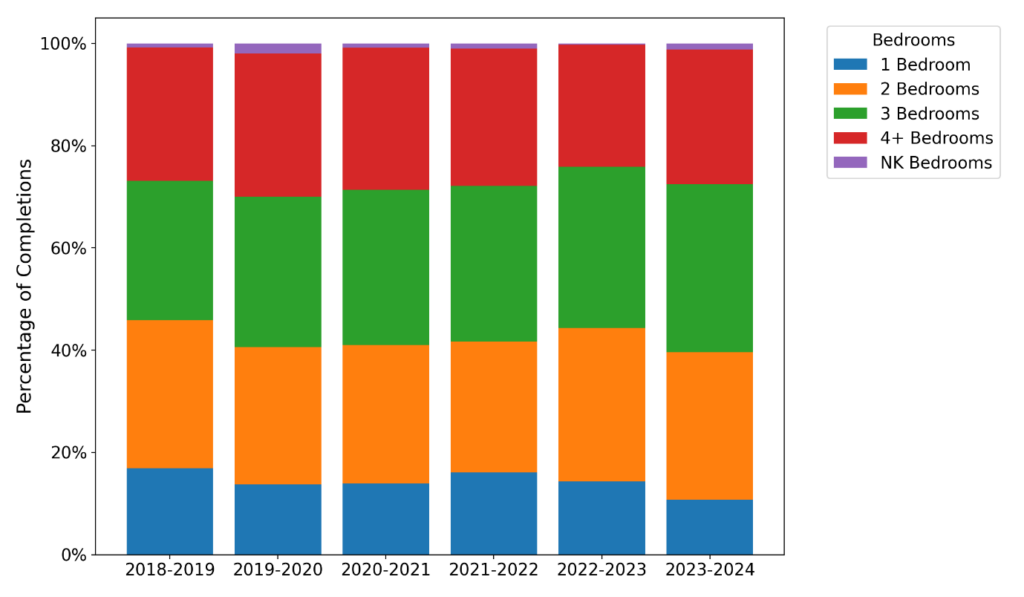 The Chart above shows the proportion of gross dwellings completed in Cambridgeshire in 2023-24 by number of bedrooms. The largest number of dwellings completed were for those with 3 bedrooms, accounting for one-third of gross completions. This is similar to the trend seen in the previous year’s housing completions activity.
Gross Housing Completions by Local Authority (2023-24)
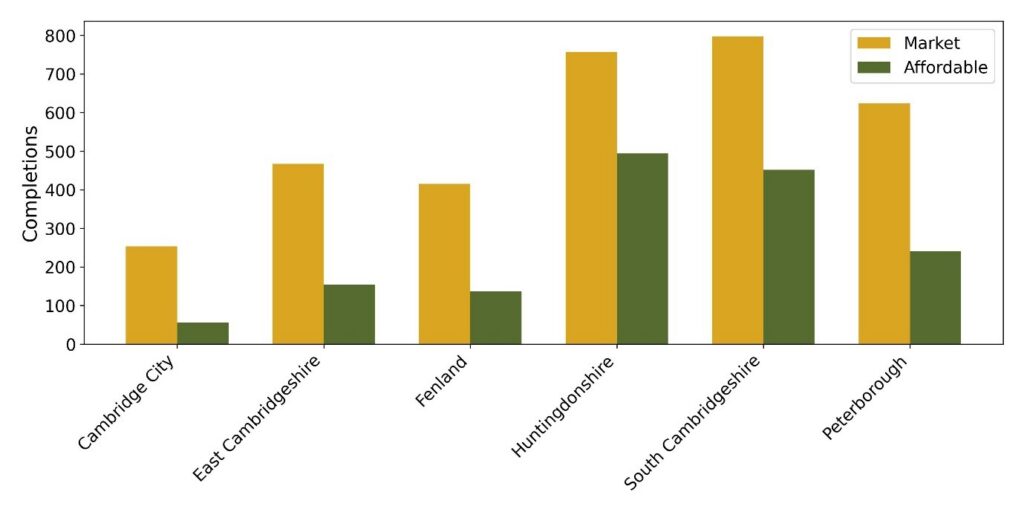 The chart above highlights the proportion of gross dwellings for each of affordable and market housing by district. Affordable housing is developed for those whose needs are not met by market housing, and includes different tenures, such as social rent, affordable rent and shared ownership, among others. The highest proportion of homes that are affordable in 2023-24 are in Huntingdonshire and South Cambridgeshire. In Huntingdonshire, 39% of gross housing completions were affordable, in South Cambridgeshire 36% were affordable. Cambridge City has the lowest proportion of ‘affordable’ dwellings of gross housing completions in the year, at 18%.
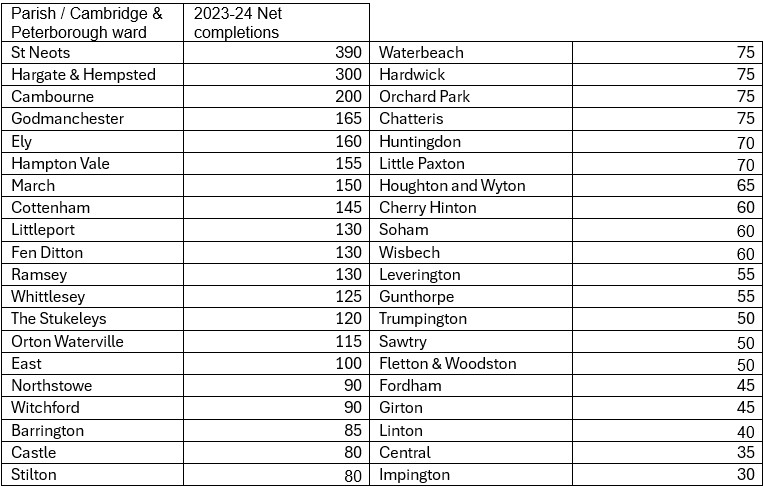
Net completions for 2023-24 by electoral ward for Cambridge and Peterborough, and by parish for East Cambridgeshire. Fenland, Huntingdonshire and South Cambridgeshire. Data rounded to nearest 5.
The table above highlights the top 40 parishes and wards with the highest number of net completed dwellings in 2023-24 (data rounded to nearest 5). The parish of St. Neots in Huntingdonshire and the ward of Hargate & Hempsted in Peterborough had the highest number of dwellings completed at 387 and 302 net completions respectively.
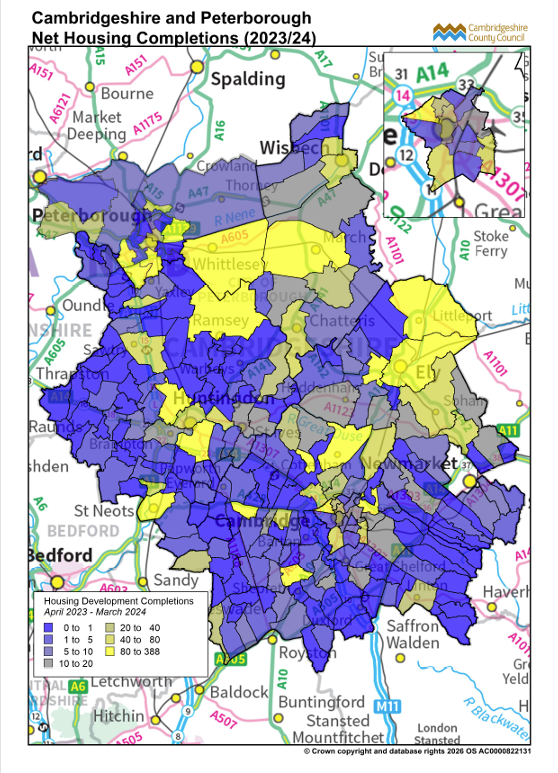
To further explore and visualise 2023-24 housing completions we used a thematic map to highlight which parishes / Cambridge and Peterborough electoral wards had the highest numbers of net housing completions. These completions can range from a single dwelling to those on large housing estates