Employment and Working Conditions
High quality employment can promote good mental health by providing fulfilment and economic benefits; whereas poor working conditions, low pay and unemployment significantly harm mental health.
Why is employment important to mental health?
- Unemployment has an enduring and multidimensional detrimental impact on mental health and wellbeing (80), including social exclusion and increased alcohol consumption (5).
- Long-term unemployment can be particularly harmful and has a long-lasting increased suicide risk (81).
- Young adults who experienced economic disruption during the first 18 months of the pandemic were at higher risk than their peers of reporting suicidal thoughts, as well as feeling defeated or trapped, key antecedents to suicidal feelings and behaviour (82).
- There is a negative impact on children of unemployed parents: 20% of children in families without a working parent have a mental health condition, over twice the rate in children where one (9%) or both (8%) parents work (21).
- There is evidence suggesting that the claims process for Universal Credit is in itself harmful to mental health (83), including increasing the risk of suicidal ideation (84).
- There are substantial inequalities in employment rates for people with mental health problems, which can compound poor mental health.
Young people who are not in employment, education or training (NEET)
- There seems to be a bidirectional relationship between mental health conditions and NEET status. Amongst young people who are NEET, there is a high prevalence of mental health problems and substance abuse issues (85).
- Youth unemployment has a long-lasting negative effect on mental health, partly due to its enduring impact of employment, with one study estimating that it results in an 8% to 15% reduction in wages at age 42 (86,87).
High- and low-quality employment
- Job roles and workplace environments can be beneficial or harmful to mental health (88).

Figure 24: Employment factors with positive and negative impacts on mental health
- Positive factors include:
- Flexible working, as this improves work-life balance and helps people manage their health conditions (89).
- A living wage, the introduction of which is associated with improved wellbeing and reduced alcohol consumption and depression rates (90).
- Peer support, job control and low levels of insecurity (65).
- Positive relationships with co-workers (91).
- Negative factors include:
- Low wages, which are a key cause of in-work poverty (92).
- Having a poor sense of rewards and little control over workload, which can lead to stress-related health conditions such as depression (5).
- Job insecurity (93): Contract types including short term, temporary or zero-hour (contracts with no minimum of paid hours) are associated with increased anxiety (5).
- Night shifts (94).
Retirement
For many people, retirement can have a positive impact on mental health as they have more time to spend doing activities they enjoy (136). However, retirement due to poor health, or needing to work for economic reasons after intended retirement age, are linked with poor wellbeing (137).
What is the national picture?
- Many disabled people face barriers to accessing and maintaining employment, and as a result, only half of disabled people are in work, compared to 75% of non-disabled people (96).
- People with common mental health conditions are 4 to 5 times more likely to be permanently unable to work, and 3 times more likely to be receiving benefits payments, than those who do not have a mental health condition(8).
- There can be a number of barriers to gaining or retaining employment, for example the symptoms of the mental illness or discrimination by employers or stigma in the workplace.
- People with a mental health condition are twice as likely to lose their job than those without a mental health condition. Around 300,000 people with a long-term mental health condition lose their job each year (85).
Young people who are not in employment, education or training
- Young people living in more deprived areas, children in care and care leavers are at a much higher risk of becoming NEET than the general population: in 2021, 41% of care leavers aged between 19 and England were NEET, compared to around 9% of the general population (98).
High- and low-quality employment
- National rates of in-work poverty are rising, with 2 in 3 working-age adults in poverty living in a household where at least 1 adult is in work (94).
- Low-income workers are more are likely to be aged between 16 to 21 years; to work in food and accommodation services; and to be women (95).
- Low paid workers are at least twice at likely to lose their job than higher paid workers (93).
What is the local picture?
Unemployment
- Across C & P, employment rates have generally increased over the past 10 years (44).
- However, the proportion of people in employment has declined in Cambridgeshire over the past 2 years (44).
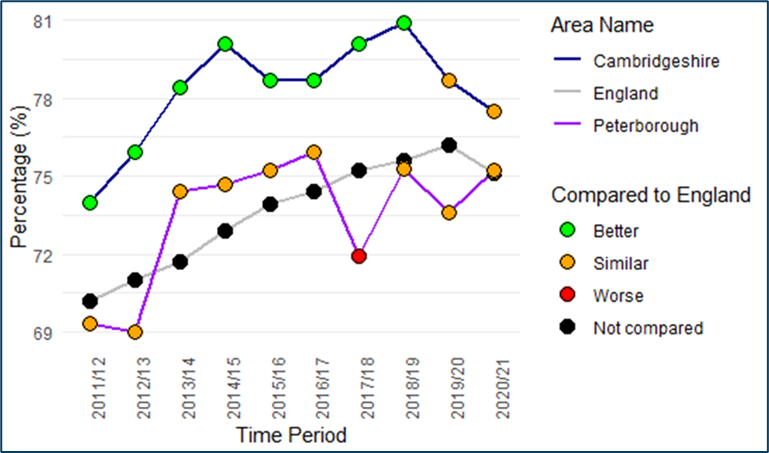
Figure 25: Employment rates across C & P, over time. Data source: (44)
- When unemployment trends are broken down by district, this exposes regional disparities. Claimant counts, which are a strong indicator of unemployment rates, are substantially higher in Peterborough compared to all other Cambridgeshire districts (Figure 23).
- The Claimant Count measures the number of people claiming benefit principally for the reason of being unemployed: from April 2015, the Claimant Count includes all Universal Credit claimants who are required to seek work and be available for work, as well as all JSA claimants.
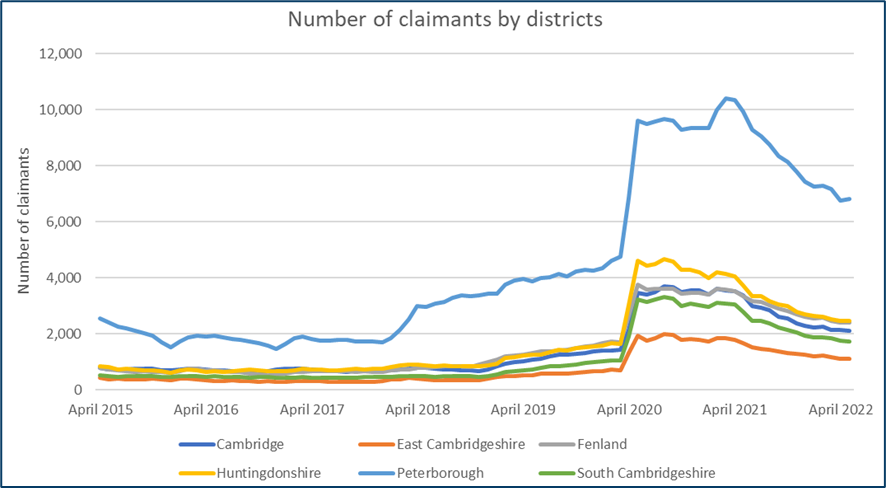
Figure 26: Number of people claiming unemployment benefits (Universal Credit claimants who are required to seek work, and all Job Seekers Allowance claimants). Data source: (82)
- The majority of claimants are aged between 25 and 49 (82).
- When breaking down Universal Credit applications in C & P by claimant counts, increasing numbers of people on Universal Credit have no work requirements (102). This means that people are not required to look for work, for example they may be receiving Universal Credit to top up their wages.
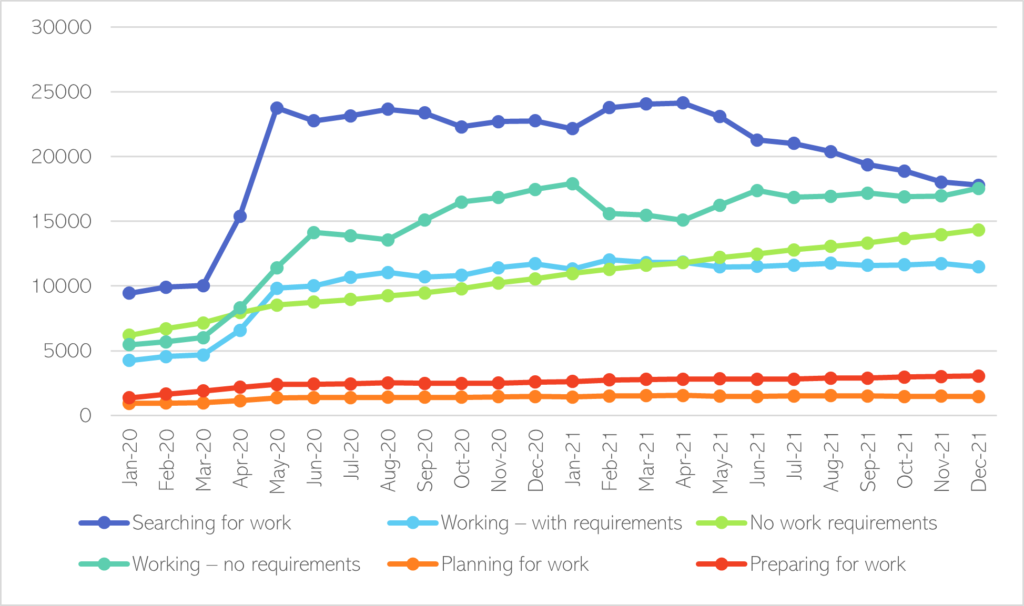
Figure 27: Universal credit applications in C & P by claimant counts. Data source: (102)
- The rate of Employment Support Allowance (ESA) claimants with mental health problems is significantly higher than the national average in both Fenland and Peterborough.
- This data covers ESA claimants who are designated as having a ‘mental and behavioural disorder’, which is based on their primary disabling condition as decided by their GP. There may be claimants with mental and physical health conditions who are not included in these figures.
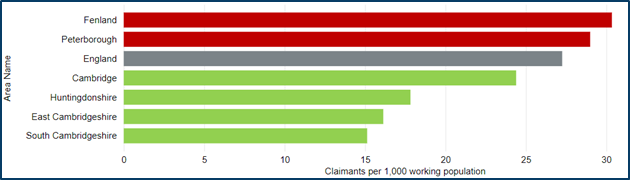
Figure 28: Rates of ESA claimants for those with mental health problems. Data source: (101)
Young people who are not in employment, education or training
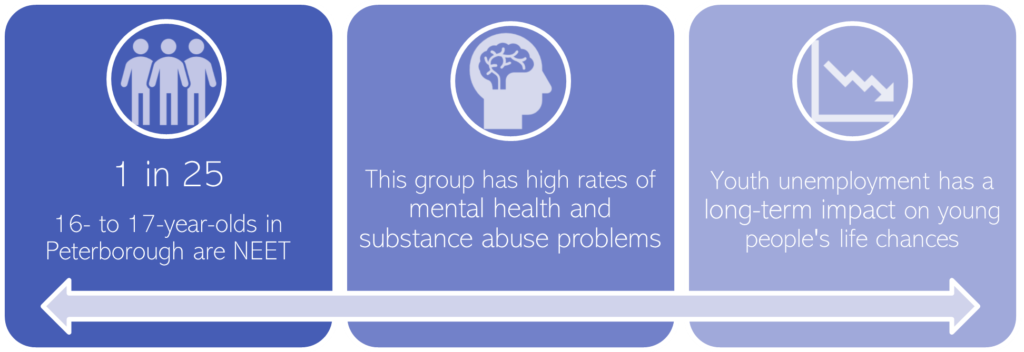
- The proportion of young people who are NEET has remained relative stable over the past few years, with 2020 figures stating that 2.7% of 16- and 17-year-olds (350 young people) in Cambridgeshire are NEET (103).
- Contrastingly, 4.0% of 16- and 17-year-olds are known to be NEET in Peterborough (195 young people), consistently above the national average (2.8%) (103).
- These rates are likely to have increased over the COVID-19 pandemic, which has had a particularly strong impact on unemployment rates of 16 to 24-year-olds.
Retirement
The proportion of older adults in who are economically active (in employment) ranges from 16.2% in Cambridge, to 9.8% in Fenland. This is likely to reflect differences in the age breakdowns of these areas.
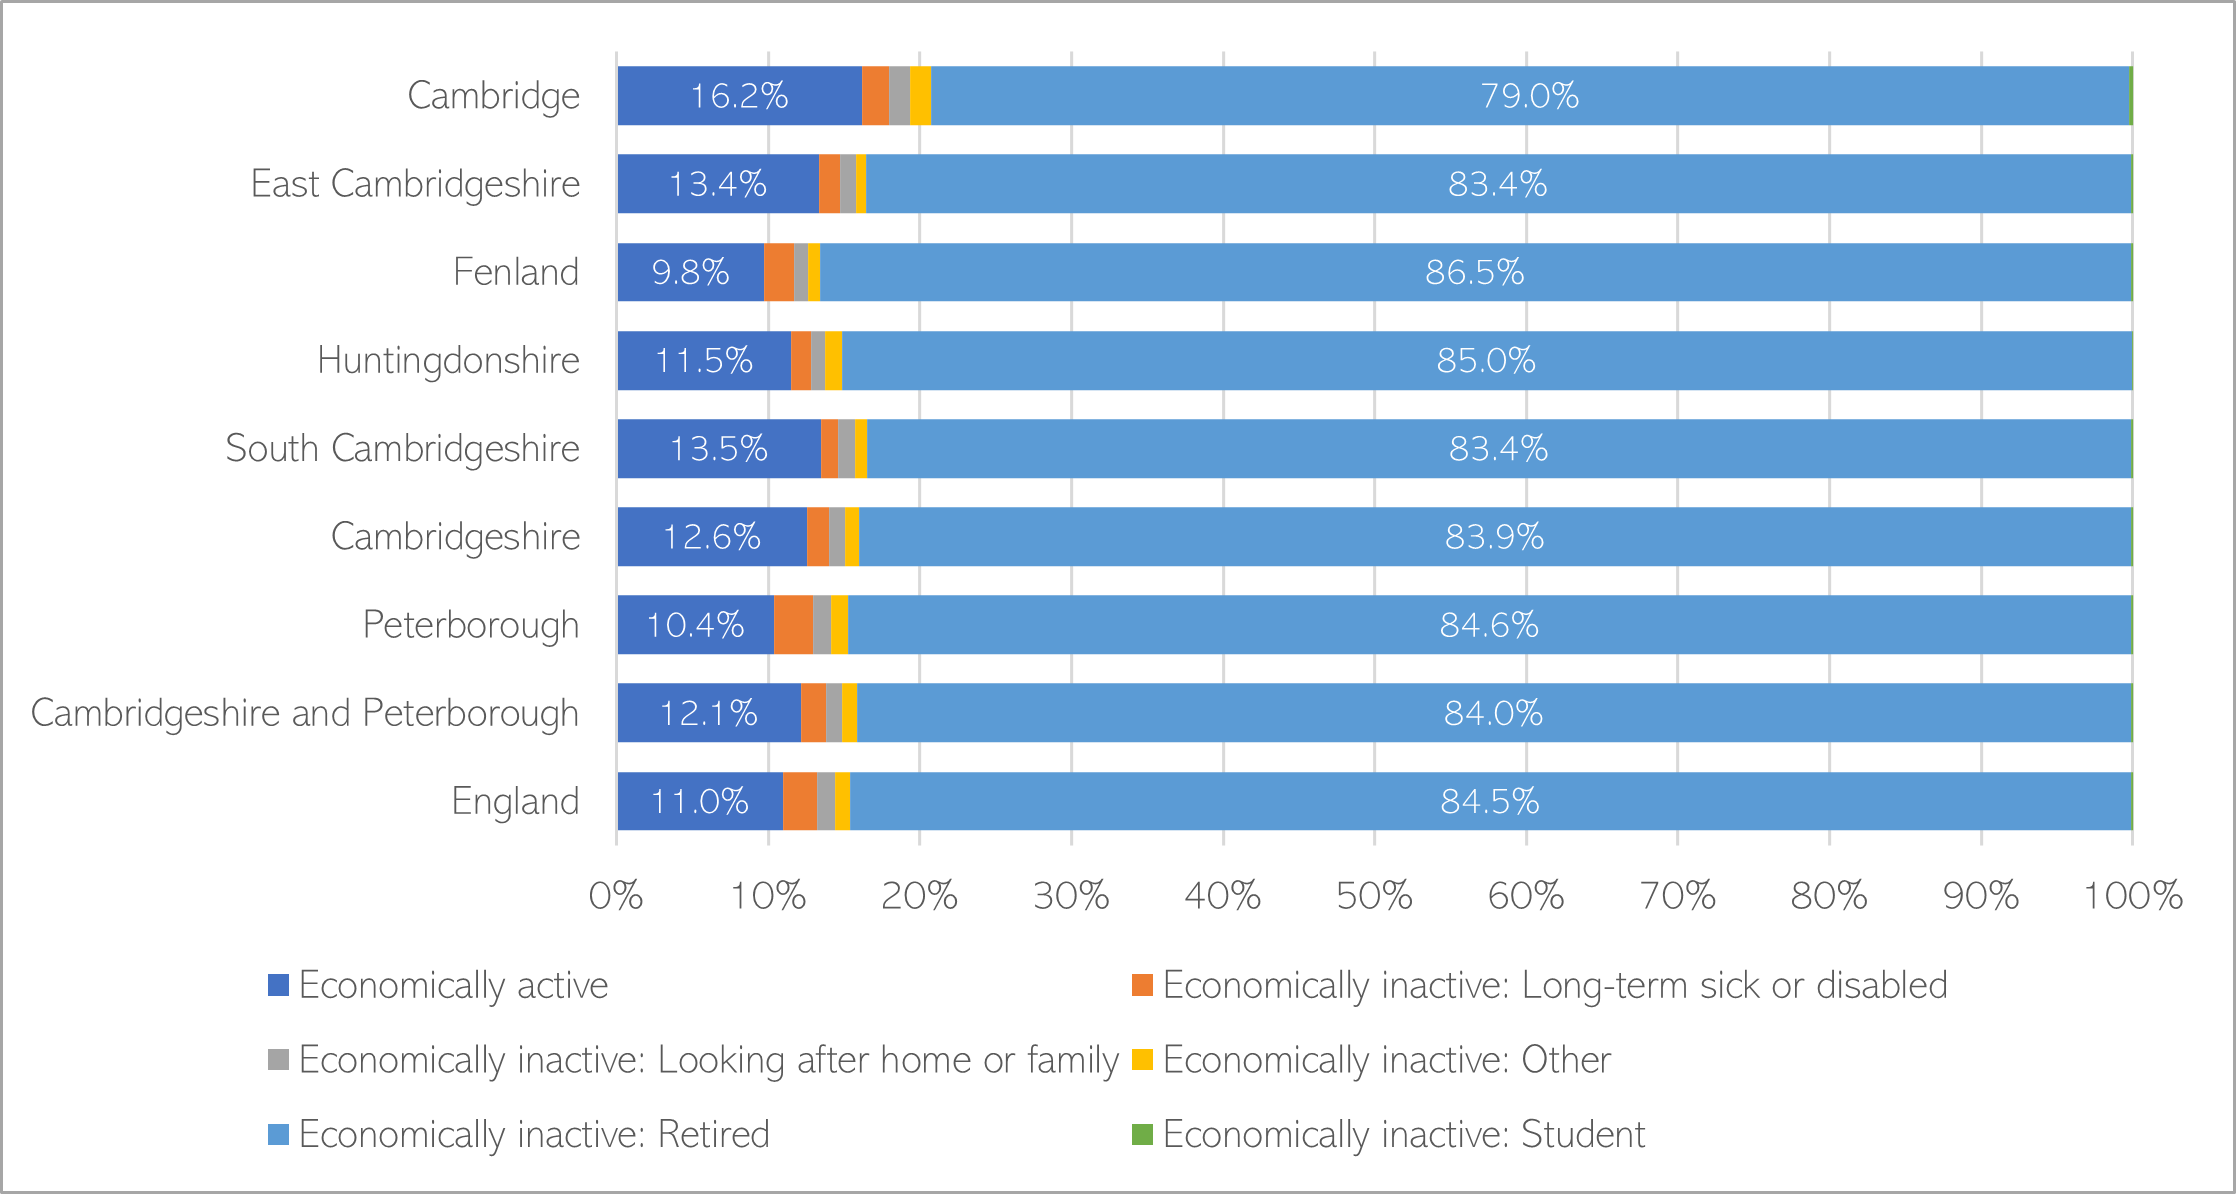
Figure: Economic activity amongst older adults (aged 65+). Data source: Source: Create a custom dataset – Office for National Statistics (ons.gov.uk)
Employment and retirement in older age are likely to reflect socioeconomic and health inequalities: national data shows that people on lower incomes are more likely to leave work due to poor physical health or disability; whilst those on higher incomes are more likely to leave work early by choice (138). In Cambridgeshire and Peterborough (139):
- There are high levels of socioeconomic and health inequalities. Some people with lower socioeconomic status may face more physically demanding jobs, whilst also being less able to afford to retire. These inequalities may occur between districts (for example, Peterborough has higher levels of deprivation) and within smaller areas.
- High housing prices and poor public transport links in some areas impact job opportunities, particularly for older adults who may be less likely or less able use active transport to get to work.
- Evidence on employment for people aged 50+ in each of the districts of Cambridgeshire and Peterborough included in Employment and age in the Cambridgeshire and Peterborough area: Local evidence about workers aged 50 and older
Additional resources
- The local data pack gives an overview of key data and trends
- NIHR’s summary of the importance of employment to public mental health
- The Health Foundation’s Evidence Hub on work
- The Department for Work and Pensions report Thriving at work: a review of mental health and employers
- A meta-analysis of the psychological and physical impacts of unemployment
- Further local data on employment and youth unemployment
- How did parents’ experiences in the labour market shape children’s social and emotional development during the pandemic?
References
Full list of references can be found here
- McKee-Ryan FM, Song Z, Wanberg CR, Kinicki AJ. Psychological and physical well-being during unemployment: A meta-analytic study. Journal of Applied Psychology. 2005;90(1).
- Milner A, Page A, LaMontagne AD. Long-Term Unemployment and Suicide: A Systematic Review and Meta-Analysis. PLoS One. 2013;8(1).
- Samaritans. The impact of economic disruption on young adults. 2021.
- Wickham S, Bentley L, Rose T, Whitehead M, Taylor-Robinson D, Barr B. Effects on mental health of a UK welfare reform, Universal Credit: a longitudinal controlled study. Lancet Public Health. 2020;5(3).
- Cheetham M, Moffatt S, Addison M, Wiseman A. Impact of Universal Credit in North East England: A qualitative study of claimants and support staff. BMJ Open. 2019;9(7).
- Goldman-Mellor S, Caspi A, Arseneault L, Ajala N, Ambler A, Danese A, et al. Committed to work but vulnerable: self-perceptions and mental health in NEET 18-year olds from a contemporary British cohort. J Child Psychol Psychiatry. 2016;57(2).
- Gregg P, Tominey E. The wage scar from male youth unemployment. Labour Econ. 2005;12(4).
- Strandh M, Winefield A, Nilsson K, Hammarström A. Unemployment and mental health scarring during the life course. Eur J Public Health. 2014;24(3).
- Bloomer E. Local action on health inequalities: Increasing employment opportunities and improving workplace health [Internet]. 2014 [cited 2022 Oct 3]. Available from: https://assets.publishing.service.gov.uk/government/uploads/system/uploads/attachment_data/file/356064/Review5_Employment_health_inequalities.pdf
- Osteen P, Frey J, Byrne K, Arciniegas J, Wilke D, Bazell A. The Mediating Role of Flexible Work Policies on Worker Mental Health. 2020.
- Bloomer E. Local action on health inequalities: Health inequalities and the living wage [Internet]. 2014 [cited 2022 Oct 3]. Available from: https://assets.publishing.service.gov.uk/government/uploads/system/uploads/attachment_data/file/357407/Review6_Living_wage_health_inequalities.pdf
- Steffens NK, Haslam SA, Schuh SC, Jetten J, van Dick R. A Meta-Analytic Review of Social Identification and Health in Organizational Contexts. Personality and Social Psychology Review. 2017;21(4).
- Child Poverty Action Group. In-work poverty [Internet]. 2022 [cited 2022 Oct 5]. Available from: http://www.appgpoverty.org.uk/wp-content/uploads/2022/07/APPG_Poverty_in_work_poverty_FINAL.pdf
- Rönnblad T, Grönholm E, Jonsson J, Koranyi I, Orellana C, Kreshpaj B, et al. Precarious employment and mental health: A systematic review and meta-analysis of longitudinal studies. Vol. 45, Scandinavian Journal of Work, Environment and Health. 2019.
- Angerer P, Schmook R, Elfantel I, Li J. Night Work and the Risk of Depression: A Systematic Review. Dtsch Arztebl Int. 2017;114(24).
- Faragher EB, Cass M, Cooper CL. The relationship between job satisfaction and health: A meta-analysis. Occup Environ Med. 2005;62(2).
- Department for Work and Pensions. Improving lives: the future of work, health and disability. 2017.
- Stevenson D, Farmer P. Thriving at work: a review of mental health and employers. Department for Work and Pensions. 2017.
- Association for Young People’s Health. Young people not in education, employment or training (NEET) [Internet]. 2022 [cited 2022 Nov 4]. Available from: https://ayph-youthhealthdata.org.uk/health-inequalities/drivers-of-inequalities/young-people-not-in-education-employment-or-training-neet/
- Office for National Statistics. Low and high pay in the UK: 2021 [Internet]. 2021 [cited 2022 Oct 5]. Available from: https://www.ons.gov.uk/employmentandlabourmarket/peopleinwork/earningsandworkinghours/bulletins/lowandhighpayuk/2021
- Cominetti N, Costa R, Datta N, Odamtten F. Low pay and insecurity in the UK labour market [Internet]. 2022. Available from: www.nuffieldfoundation.org.
- Office for National Statistics. benefit claimants – employment and support allowance [Internet]. NOMIS. 2022 [cited 2022 Oct 4]. Available from: https://www.nomisweb.co.uk/datasets/besa
- Office for National Statistics. Claimant Count / Jobseekers Allowance [Internet]. NOMIS. 2022 [cited 2022 Oct 25]. Available from: https://www.nomisweb.co.uk/articles/1310.aspx
- Department for Education. NEET and participation: local authority figures [Internet]. 2021 [cited 2022 Oct 4]. Available from: https://www.gov.uk/government/publications/neet-and-participation-local-authority-figures